Monitoring TIBCO ActiveSpaces
OnTIBCO Monitoring
 TIBCO ActiveSpaces appears to be gaining traction in the marketplace for in-memory data grids against competitors like Oracle Coherence as well as open source alternatives. For many E-Commerce applications it offers an effective solution for session caching, optimizing access to database content, and data replication on a large scale.
In these systems, scaling is achieved by distributing load across many individual processing nodes running on multiple physical or virtual platforms. All of the nodes, or “members”, function in aggregate to provide applications with a seamless implementation of a large data cache, or “space” that spans the boundaries of any one machine. This type of architecture can provide data backup and fault tolerance as additional benefits.
The problem is that these technologies are complex and highly sophisticated. Consequently, they can be fragile if their behavior is not monitored carefully and their properties not tuned correctly. Unfortunately, this complexity often obscures the internal behavior and its functioning can be something of a “black box”, the contents of which are largely invisible.
Seeing Inside the Black Box
It is not that you cannot see anything inside the black box. Vendors typically provide some limited capability, either through JMX, a custom admin API, or in the case of TIBCO Active Spaces, a “query space” that contains monitoring metrics. The problem is that these vendor-provided solutions tend to be very limited, providing access to metrics only one node at a time or one space at a time. It is left as an exercise for the user to assemble a comprehensive view that adequately represents the overall health of the system.
A global, consolidated, view is especially important when it comes to in-memory data grids. Typically, data and activity (gets / puts) are not evenly distributed across a grid that contains multiple, independently typed spaces. Data spaces of disparate sizes can be instantiated on different subsets of members, some overlapping, some not. Content size and activity metrics should be evenly distributed across all members within a single space, but this does not hold true across the entire grid. It is essential to be able to quickly determine and remedy those situations where individual members may be overloaded and are causing a performance bottleneck affecting users.
Alerting on Exceptional Conditions in a Dynamic Data Grid
When a condition occurs in the data grid that may cause excessive load or member failure, you want to be able to send an alert so that it gets attention right away. If a data grid is reasonably small and static, it is possible to use the TIBCO Hawk Console to define alerts on each member in the grid, and notify users if any member goes down, for example. However, when the grid gets larger (e.g. > 10 members) or when new members are being added dynamically, it is not practical to manually define Hawk alerts on each individual member, one at a time.
In this case (a common one), an alert configuration mechanism that dynamically assigns alerts to each member and space as they come and go makes managing the system much easier as it undergoes change. For example, in the display shown to the right, the Solution Package for TIBCO ActiveSpaces provided by SL Corporation has automatically calculated an alert state for over 100 members with just one configuration step. More than a dozen pre-defined alert conditions can be detected and maintained within a dynamically changing grid easily using this approach.
Alerts can warn the administrator when any of the following conditions occur that may impair the performance or viability of the cluster
- The load on the cluster is excessive in terms of gets/puts/takes/evicts/expires per second, or the size of the space.
- The number of seeders in a space is low. (ActiveSpaces requires a minimum number of seeders to provide redundant storage for and responsive access to the space).
- The activity of a given space member is excessive in terms of gets/puts/takes/evicts/expires per second, or the number of entries contributed to the space.
Correlating ActiveSpaces Monitoring Data with Other Components
A data grid like ActiveSpaces is provided most often as a service to one or more applications that are built using many other component technologies. In the TIBCO world, this usually means some combination of BusinessWorks, BusinessEvents, and TIBCO EMS for messaging. To get a complete picture of the health state of an application that is dependent on such disparate underlying technologies, it is necessary to provide a mechanism for correlating the monitoring metrics obtained from all components of all types.
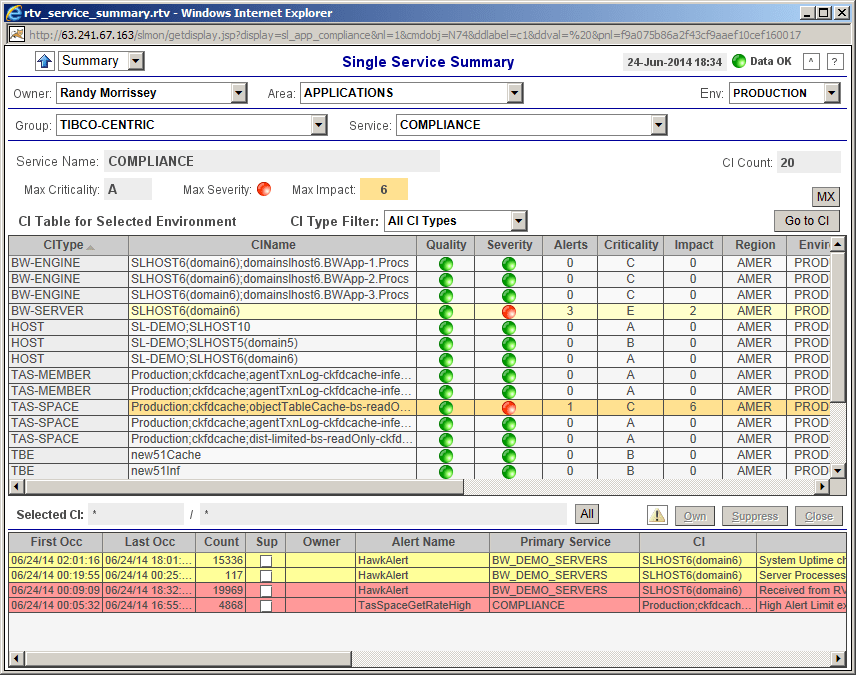 The image to the right shows the composition of an example application, COMPLIANCE, which is built on a number of different (mostly TIBCO) technologies. These are identified as BW-SERVER, BW-ENGINE, TAS-SPACE, TAS-MEMBER, TBE-ENGINE, HOST, TOMCAT, and others. Each row represents one or more components of that specific type and shows the highest alert state for all components of that type. The health state of the complete application is an aggregate of the health or alert state of each component. Alerts that are relevant to the COMPLIANCE application are shown at the bottom of the page. From here, one is able to drill down to details about each individual component and investigate in summary pages and trend charts the history and current state of that component.
This is but one form of service or application level correlation of monitoring metrics across multiple component types. RTView provides industrial-strength real-time monitoring of many different technologies, especially the middleware, app servers, and data grids used to integrate large scale complex applications. There is a multitude of ways in which RTView can provide comprehensive, consolidated, aggregate views of the health state of applications that are built on top of TIBCO middleware components.
Specifically with regard to monitoring ActiveSpaces, RTView provides rich visualization and insights into the overall performance and utilization of each space in one or more metaspaces, how data are distributed across the members of a cluster hosting each space, and where the “hot spots” are in each cluster. It also provides detailed information about how space members interact with the space (their role and statistics – data volume, and gets/puts/takes per second). This knowledge enables the system administrator to dynamically manage system resources in order to maintain high performance of the cluster. You can find more information here: Solution Package for TIBCO ActiveSpaces.
I published another blog recently, RTView for TIBCO – More Than APM. In it, I discuss how RTView significantly augments the basic monitoring capabilities provided by TIBCO, as well as how it can be used to correlate information from multiple TIBCO components as well as non-TIBCO components, such as Oracle WebLogic or IBM WebSphere, to provide a comprehensive end-to-end view of critical applications.
https://sl.com/products/Tibco-ActiveSpaces-Monitor-Solution-Package.shtml
Tags: TIBCO ActiveSpacesCategories: TIBCO Monitoring