MuleSoft Monitoring with RTView enables application support, middleware support and DevOps teams to monitor their MuleSoft-powered applications from end-to-end. From the application layer and the middleware layer, right on down to the infrastructure resources that support it all.
Key Features:
- Monitor real-time performance for early warning
- Analyze historical performance to differentiate trends and spikes
- Out of the box discovery and monitoring of key metrics and resources
- Powerful diagnostics and correlations for complex performance analysis
- View MuleSoft performance metrics in an application context
- Instant insight for MuleSoft resource management
- Minimal training, highly configurable by business and technical users
Metrics for Mulesoft
- MuleSoft Servers
- Connection Status, Alert Level, Alert Count, # Apps, Host Name, Host IP, Port, JDK Version, OS Version, Build Date, Build Number, Timestamp
- Statistics (Count, Delta & Rate): Async Events, Sync Events, Processed Events, Total Events, Execution Errors, Fatal Errors
- Performance Trend Graphs: JVM, % CPU, Max Heap, Used Heap, Max Time, Avg Time, Total Events, Errors
- MuleSoft Applications
- Connection, Application, Alert Severity, Alert Count, Start Time, Time Stamp
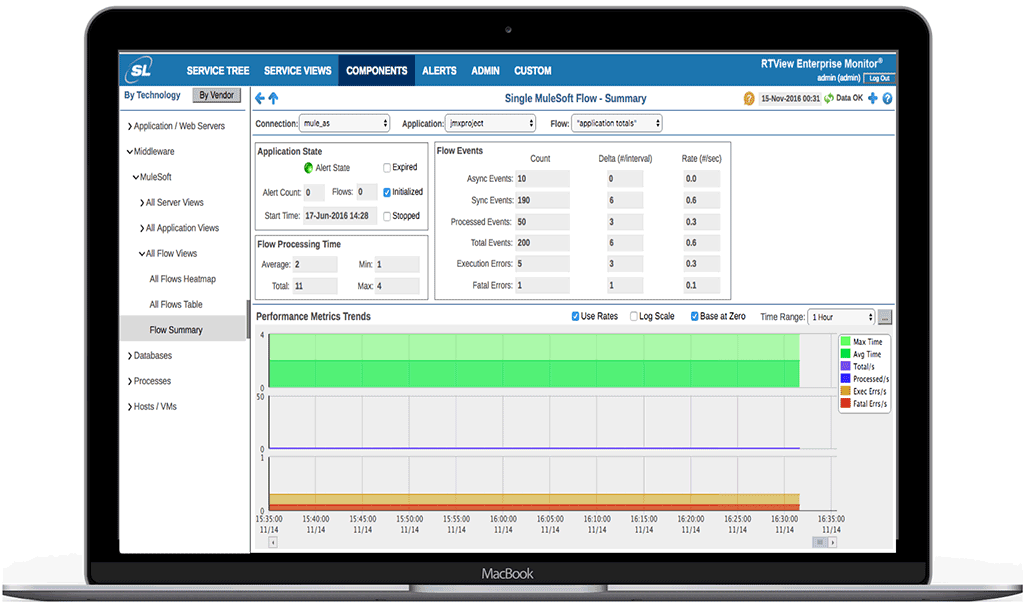
- Application State: Alert State, Alert Count, # Flows, Start Time, Initialized, Expired, Stopped
- Flow Processing Time: Average, Total, Min, Max
- Flow Events (Count, Delta & Rate): Async Events, Sync Events, Processed Events, Total Events, Execution Errors, Fatal Errors
- Performance Trends: Max Time, Avg Time, Total/s, Processed/s, Exec Errs/s, Fatal Errs/s
- MuleSoft Flows
- Connection, Application, Flow, Async Events Received, Sync Events Received, Total Events Received, Execution Errors, Fatal Errors, Avg Processing Time, Max Processing Time, Min Processing Time, Total Processing Time, Delta Async Events Received, Delta Sync Events Received, Delta Execution Errors, Delta Fatal Errors, Rate Async Events Received, Rate Sync Events Received, Rate Execution Errors, Expired, Timestamp
- Application State: Alert State, Alert Count, # Flows, Start Time, Initialized, Expired, Stopped
- Flow Processing Time: Average, Total, Min, Max
- Flow Events (Count, Delta & Rate): Async Events, Sync Events, Processed Events, Total Events, Execution Errors, Fatal Errors
- Performance Trends: Max Time, Avg Time, Total/s, Processed/s, Exec Errs/s, Fatal Errs/s
Prebuilt Displays
- MuleSoft Servers: All Servers Heatmap, All Servers Table, Server Summary
- MuleSoft Applications: All Applications Heatmap, All Applications Table, Application Summary
- MuleSoft Flows: All Flows Heatmap, All Flows Table, All Flows Summary
Get all the latest news and updates from RTView
Don’t worry you can unsubscribe at any time!
These companies trust RTView Kafka Monitoring®. You can too!


How is RTView a game-changer for your business?
RTView is the world’s highest performance and lowest
overhead solution designed specifically for
middleware monitoring.
Need more answers?
Send us a message


