TIBCO EMS Monitoring with RTView®
Turnkey, out-of-box monitoring and alerting for TIBCO EMS middleware
Turnkey, out-of-box monitoring and alerting for TIBCO EMS middleware

No need to spend your time building displays. RTView comes complete with a full suite of monitoring views designed to provide with the information you need to keep your TIBCO systems up and running 24/7.
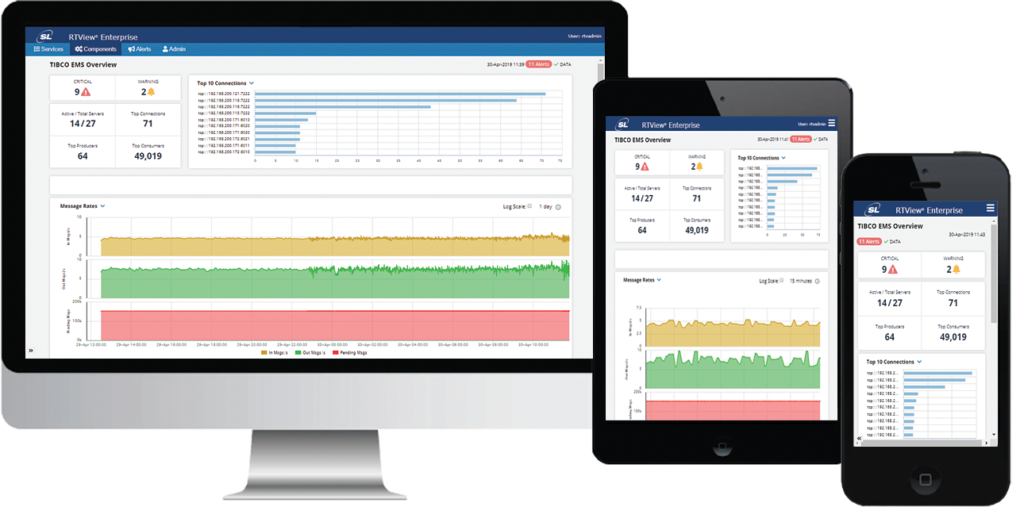

No need to spend your time building displays. RTView comes complete with a full suite of monitoring views designed to provide with the information you need to keep your TIBCO systems up and running 24/7.
Monitor TIBCO EMS with RTView from T Wilson on Vimeo.
No need to spend your time building displays. RTView comes complete with a full suite of monitoring views designed to provide with the information you need to keep your TIBCO systems up and running 24/7.
No need to spend your time building displays. RTView comes complete with a full suite of monitoring views designed to provide with the information you need to keep your TIBCO systems up and running 24/7.
Become more proactive with alerting tailored to the needs of specific support teams. RTView provides pre-configured alerts to simplify initial setup and maintenance.
Become more proactive with alerting tailored to the needs of specific support teams. RTView provides pre-configured alerts to simplify initial setup and maintenance.
Solution Package for TIBCO EMS provides a powerful and flexible way to view and access critical EMS information. At the top level, the Solution Package provides heatmaps, tables and grid views of All EMS Servers, with the ability to filter by individual variables such as alert severity, alert counts, connections, pending messages, in/out rates, and memory consumption.
Solution Package for TIBCO EMS provides a powerful and flexible way to view and access critical EMS information. At the top level, the Solution Package provides heatmaps, tables and grid views of All EMS Servers, with the ability to filter by individual variables such as alert severity, alert counts, connections, pending messages, in/out rates, and memory consumption.
When combined with other TIBCO-specific Solution Packages in RTView® Enterprise Edition, performance metrics and alerts from TIBCO EMS, TIBCO FTL, TIBCO BW, and TIBCO BE, TIBCO ActiveMatrix, TIBCO ActiveSpaces and TIBCO Hawk can all be aggregated into a set of consolidated views. The cross-correlation of this information across TIBCO middleware components further enables rapid determination of fault state, speeding troubleshooting, assessment of business impact, and resolution of critical issues.
By combining these TIBCO monitoring solutions along with other solutions under the RTView® Enterprise umbrella, it’s easy to uncover how TIBCO EMS, BW, and BE instances are affecting the critical applications in your enterprise, and the underlying root causes for such. One can also consolidate metrics from existing monitoring solutions and tools in order to provide visibility across an entire application infrastructure, including TIBCO applications and other critical application components.
Using RTView® Enterprise’s Service Model functionality, you are able to create service models that allow you to trace service impact and prioritize issues based on their potential affect on the business.
When combined with other TIBCO-specific Solution Packages in RTView® Enterprise Edition, performance metrics and alerts from TIBCO EMS, TIBCO FTL, TIBCO BW, and TIBCO BE, TIBCO ActiveMatrix, TIBCO ActiveSpaces and TIBCO Hawk can all be aggregated into a set of consolidated views. The cross-correlation of this information across TIBCO middleware components further enables rapid determination of fault state, speeding troubleshooting, assessment of business impact, and resolution of critical issues.
By combining these TIBCO monitoring solutions along with other solutions under the RTView® Enterprise umbrella, it’s easy to uncover how TIBCO EMS, BW, and BE instances are affecting the critical applications in your enterprise, and the underlying root causes for such. One can also consolidate metrics from existing monitoring solutions and tools in order to provide visibility across an entire application infrastructure, including TIBCO applications and other critical application components.
RTView® Enterprise is a platform inside which any number of solution packages can be hosted, aggregating component-level data and viewing/managing/correlating these data as a whole. Without RTView® Enterprise Edition, users would be able to view only each individual data source, albeit with advanced visualizations and real-time granularity, but without the ability to aggregate and compare critical event data across all the relevant components of an enterprise deployment environment. With RTView® Enterprise Edition, users can cross-correlate and perform root cause analysis across multiple components from multiple vendors (e.g., TIBCO, IBM, Oracle and VMware), from the host and network level through the database and middleware layers up to the application itself.
RTView® Enterprise enables direct or indirect collection of data at the Solution Package level. Solution Packages are available for multiple off-the-shelf components across all of the tiers in common deployment architectures, including infrastructure (hardware, OS, network, storage and database), middleware (app servers, data grids, messaging systems, SOA and event processing servers, etc.) and UI/UX components and processes.
| Feature | Benefit |
| Historian with data compaction |
|
| Browse Topics and Queues |
|
| Administer, View, or Customize EMS Alerts |
|
| View inbound, outbound, and pending message count on any EMS server |
|
| View Async and Sync DB sizes and usage |
|
| Monitor Connection Count |
|
| Automatically generated topology view |
|


