RTView For Oracle – More Than OEM
OnApplication Monitoring, End to End Monitoring, Oracle Monitoring
 Load-balanced, parallel, and complex … these words apply to the large-scale, distributed, mission-critical applications built on top of Oracle middleware components like WebLogic and Coherence. The resulting systems can be highly functional and scalable, but also very fragile. The probability of failure increases exponentially with complexity.
Many large organizations are dependent on these applications for millions or even billions of dollars of revenue. Yet, they will literally cripple their support staff by forcing them to monitor the fast-changing health and performance of these complex systems using vendor-supplied tools designed fundamentally for server management, not for real-time performance monitoring.
Oracle offers Enterprise Manager (OEM) as a general-purpose lifecycle management tool for deploying, starting and stopping, and otherwise controlling these middleware technology components. While OEM does include some basic monitoring functionality, its primary purpose is management of servers one at a time. It needs to be complemented with more sophisticated tools (like RTView) that can provide an integrated, holistic, and real-time view that correlates monitoring data across multiple application components at once. This involves a lot more than simply collecting and presenting monitoring data from each technology, as illustrated in the following concrete examples.
Analysis of Load-Balancing Behavior and Performance
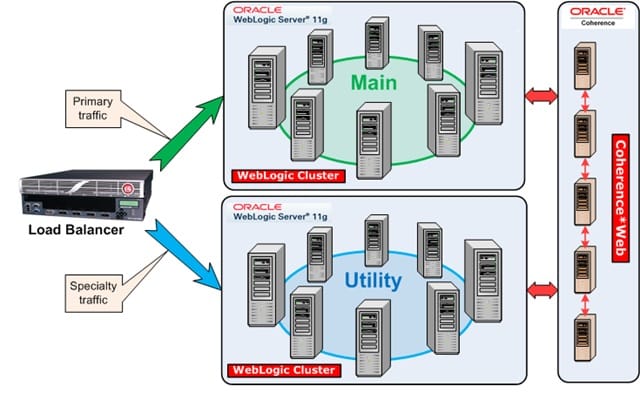
WebLogic servers are almost always deployed in “clusters” and applications are installed in conjunction with load-balancing hardware or software. This allows a very large customer load to be distributed across multiple servers, permitting the application to scale effectively. Additional servers are sometimes allocated on-demand during peak traffic times.
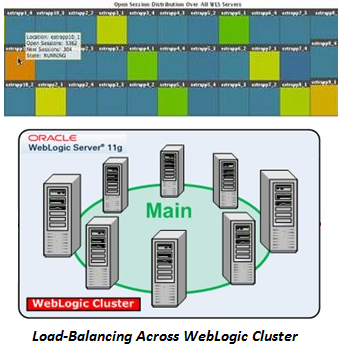 When deployed in this way, it is essential to understand key relationships between the servers. Using the WebLogic Administrator console and tools provided by OEM, it can be challenging to see levels of activity, session counts, response times, and the like aggregated across all servers in a cluster. Typically, a support person needs to navigate to one server at a time, searching for metrics of interest, or assemble custom views in order to get a decent picture of what is happening in an application.
In contrast, RTView provides out-of-the-box visualizations and alerts against all important metrics automatically aggregated across the cluster. Groups of related components are treated as a unit, with metrics aggregated and presented in high level summary fashion. This makes it possible to correlate activity across all servers and other supporting infrastructure, such as messaging systems, data grid, or host infrastructure and to determine whether all service components are performing effectively and are properly load balanced. This can be especially useful for validating functionality of an application after changes have been made over a weekend, for example.
Correlation of WebLogic / Coherence Performance Metrics
Many applications use WebLogic to provide customer-facing e-commerce services that require speedy access to user and product data. Catalog, pricing, and order information is maintained in a database for persistence, and Oracle Coherence is often used to buffer that database in order to speed up access to commonly or recently accessed data. This can be a very effective solution.
 In this case, monitoring of WebLogic alone is not enough. Activity on multiple clustered WebLogic servers must be correlated with activity in the supporting Coherence backing store, both in-memory and against the database.
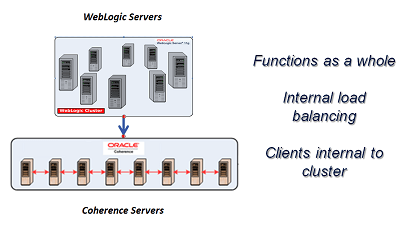
RTView is able to visualize and analyze the correlation between the WebLogic servers and the Coherence data grid layer and effectively paint a picture that makes it easier to determine quickly in which tier a problem may be brewing. While OEM may provide some of the metrics about the underlying components, it can be difficult to see the relationship between them and get early warning that something is wrong in the system. RTView can automatically detect and alert on anomalies related to this correlation.
Cross-Cluster Analysis of Coherence Proxy/Extend Connections
Another common use case for Oracle Coherence is seen in many large and critical banking applications. Applications that require fast access to large volumes of reference data or rapidly changing pricing data (as in trading applications) make use of Coherence clusters as an in-memory data store. Application processes or real user clients interact with the data via TCP connections brokered through a Proxy Server; the connecting processes are referred to as Extend Clients.
 The problem is that hundreds of such clients can connect to multiple clusters simultaneously. When one of these clients is configured incorrectly or is requesting too much data it can result in significant transmission backlog. Since the Proxy servers to which these clients connect are shared, backlog on any one can affect performance on many others. It is essential to quickly identify the source of the backlog and terminate the offending client process.
RTView is designed to correlate, aggregate, and analyze data across multiple clusters. In the case of these Extend clients, RTView provides an easy way to quickly see which clients are connected to each cluster and identify the source of any backlog. In contrast, searching through raw data tables one cluster at a time in OEM to search for clients with large backlogs would be a very inefficient way to solve this problem.
The examples described above illustrate just a few of the many ways that RTView provides value that goes way beyond what server management and monitoring systems typically provide. When you factor in its high performance data collection and correlation capabilities, RTView is indispensable to support teams for high-value critical applications, as it significantly supplements the limited functionality that is provided by the middleware vendors.
In another recent blog, RTView and Oracle Enterprise Manager, I outlined some of the fundamental differences between RTView and OEM. Reading this can provide more background on the subjects discussed above.