End-to-End Application Monitoring
Consolidated Monitoring for Applications, Middleware and Infrastructure
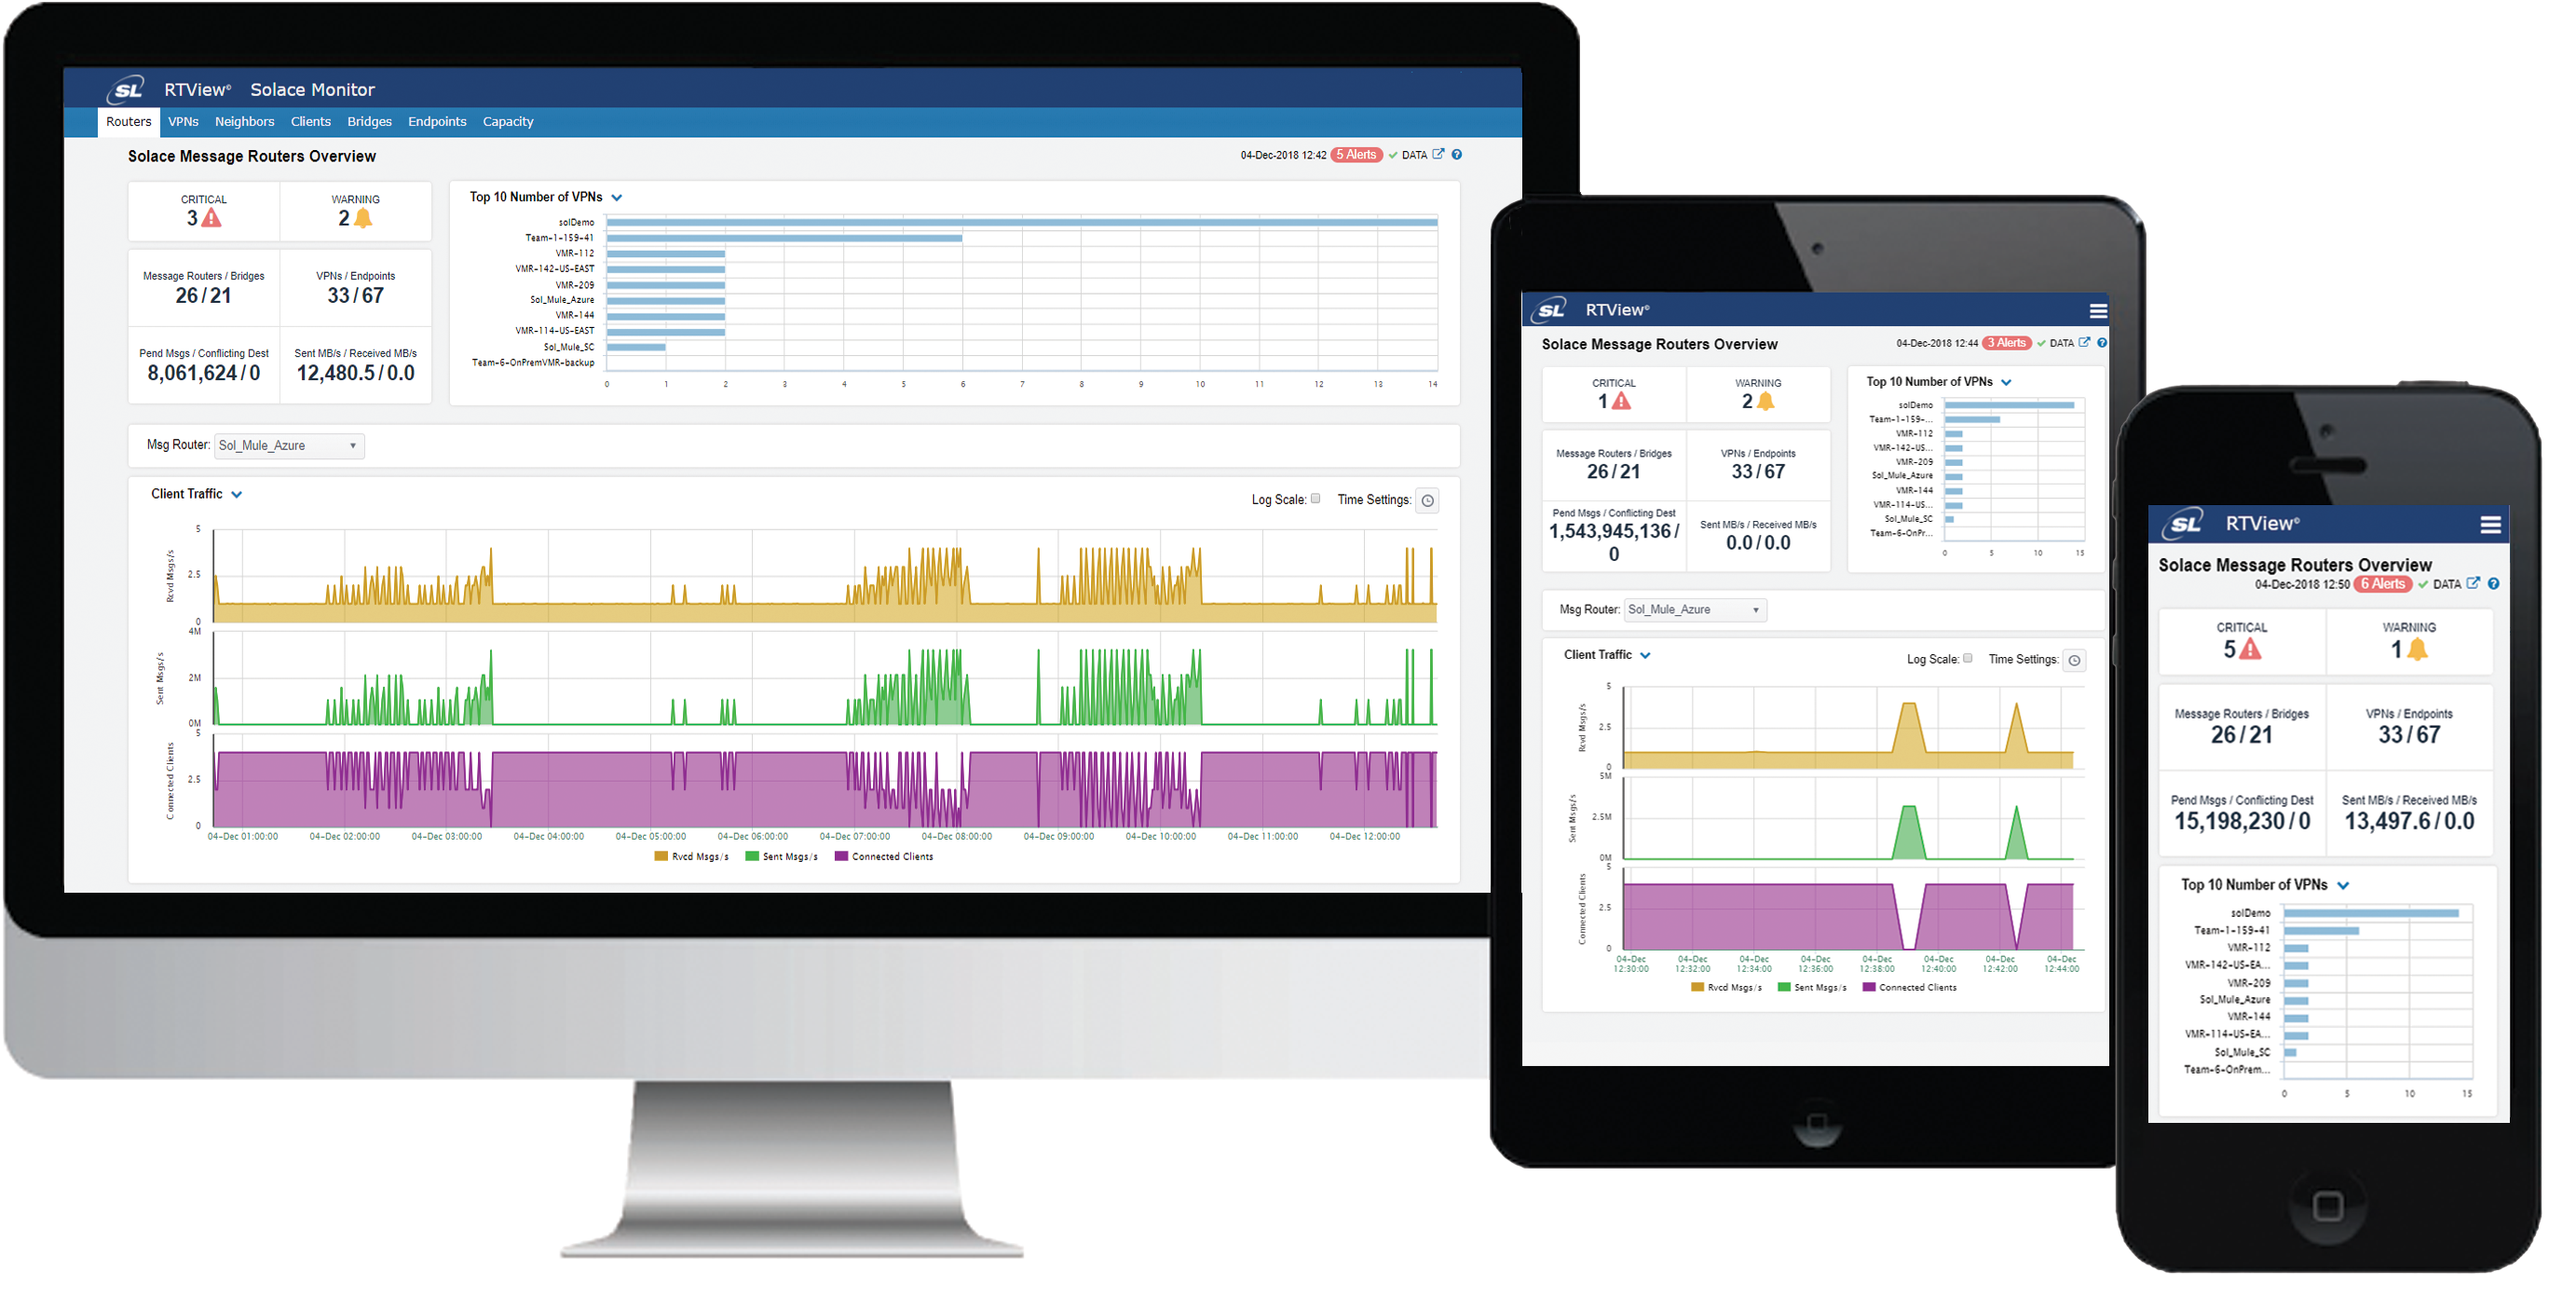
Modern applications are increasingly becoming more complex with the use of reusable services and specialized high-performance middleware technologies like messaging, business process automation, SOA, complex event processing and in-memory data grids. With each technology featuring its own monitoring console or using custom scripts, application support teams have difficulty getting a clear idea of how their middleware is affecting overall application health and performance.
End-to-End Application Monitoring platforms such as RTView® Enterprise Edition are designed to provide a real-time, end-to-end view of all application performance monitoring and health state data, across vendors and application tiers within real-time, into a single, intuitive graphical console – shared between different support and operations teams – enabling them to better manage their applications, services and technology portfolios.
Who benefits from End-to-End Application Monitoring?
- Front line support teams have a much easier time prioritizing alerts and resolving incidents
- Middleware teams can anticipate performance bottlenecks and avoid service outages
- IT operations can achieve faster recovery times
- IT architects can do better capacity analysis

“Troubleshooting without a comprehensive view of your entire application infrastructure is like feeling around in the dark”
Consolidate Performance Metrics & Improve Operational Efficiency
- Immediately identify and locate performance bottlenecks in complex systems
- React faster with granular, real-time metrics
- Reduce license, maintenance & support costs with a unified monitoring platform
|
 |
 |
Better Comprehension of Complex Applications and Infrastructure
- Visualize complex systems with intuitive data flow diagrams
- Categorize your entire infrastructure into logical groupings
- View your technology alerts in the context of application or service
|
Predict Infrastructure at Risk
- Correlate the impact of an infrastructure issue on adjacent technologies in an application context
- Visualize pre-alert system stress levels
- Identify future capacity requirements
|
 |
 |
More Effective First Response
- Diagnose deeper and faster with progressive drill-down: App > Technology > Instance
- Connect the dots between application, middleware and infrastructure performance impact
- Visualize problems as they start to develop with historical trend charts, time-synced key metric performance and real-time alerts
|
Share Data for Efficient Escalation & Collaboration
- Share “single source of truth” preliminary diagnostics with escalation teams
- Allow Middleware/infrastructure teams to see if their alerts are impacted by other technologies
- Escalate to the right teams with better front-line diagnostics and avoid the war room
|
 |