What Failed: My App or my Infrastructure ?
OnApplication Monitoring
 Matthew, a talented Application Support guy, is shown in the image to the left enjoying a relaxing day at the beach. When his boss calls, he manages to craft something of a smile, but my guess is that he is not very happy right now.
He is going to be even less happy a few hours from now, when he finds out that the big issue he was called in to troubleshoot wasn’t even his problem. Matthew is in charge of a big on-line customer-facing application and users were reporting performance problems. He did a little digging and pretty quickly determined that the problem had nothing to do with the application modules he supports; rather, one of the JMS Servers in the middle tier had run out of memory and crashed forcing traffic to be routed through a slower backup server.
This is an all too common problem. The Application Support people, who know the most about how the applications work, are the first to get called whenever there is a problem. In many of those calls, however, the problem turns out to be down in the infrastructure or middleware layer, usually managed by a totally different group of people. But the Application Support people have to figure that out first, then tell the boss to call the infrastructure people instead. It is easy to imagine a lot of wasted people-hours doing things this way.
Like most Application Support people, Matthew has all kinds of monitoring tools available to him. It usually doesn’t take him long to figure out what the problem is. In most cases, he doesn’t need some sophisticated artificial intelligence event analysis tool, with all the bells and whistles. He just needs an easy way to quickly get at all the relevant data and he can usually spot the problem right away.
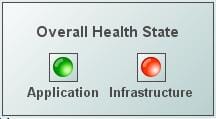 The one thing, however, that would be of tremendous value to him is something like the display you see to the right. When a problem occurs, if Matthew could instanly expose to other people, including his boss, a simple web page that shows whether the problem is in the application code or in the infrastructure … then they wouldn’t have to call him unless he is actually needed!
Well, you guessed it … this is exactly what RTView is designed to do! Indeed, there is a lot of sophistication that goes into RTView’s collection of important monitoring metrics, archiving those to a database for historical comparison, aggregating data across banks of servers, and determining the overall health state of individual applications. But one of the most powerful features of RTView is its ability to filter monitoring metrics and alert states in such a way that support people are able to see exactly, and only, what they need to see to get their work done … greatly improving their efficiency.
RTView can aggregate the metrics and alerts that are relevant to each individual application, independently from those that are relevant to the infrastructure or middleware (or any other grouping that apply to an organization). That information can be presented in high-level summary views to management (solving Matthew’s problem) or filtered down for each individual support person showing only what they are responsible for.
If he had a tool like RTView at his disposal, Matthew could easily have avoided that call at the beach, and he might actually have been able to enjoy the whole day there !
Categories: Application Monitoring