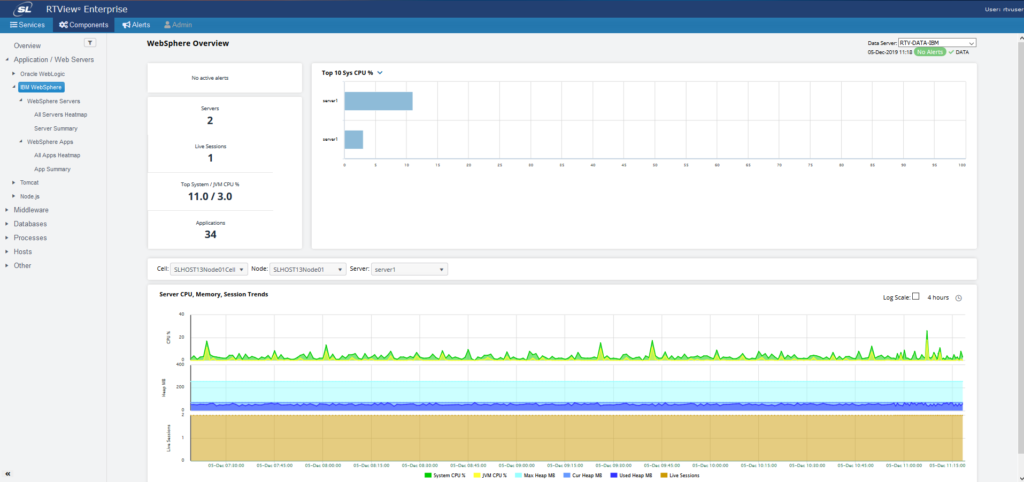
Gain real-time visibility into the health and performance of WebSphere Application Server and deployed applications.
RTView® Enterprise Edition and the Solution Package for WebSphere provide out of box performance and availability monitoring for support teams and WebSphere administrators. It enables users to ensure effective resource allocation by providing access to a wide variety of current and historical metrics.
Configuration options enable both consolidated views across the enterprise as well as views configured for specific support teams. As part of an end to end monitoring solution, users can view WebSphere performance in the context of an application or service. This provides visibility into how WebSphere performance is impacting adjacent technologies and the resulting business impact. Typical installations of RTView® Enterprise Edition and its Solution Packages take only a few hours, while developing custom views for a variety of IT and development roles can be achieved in just days.
Key Features
- Monitor real-time performance for early warning
- Analyze historical performance to differentiate trends and spikes
- Out of the box discovery and monitoring of key metrics and resources
- Ensure effective resource allocation
- Powerful diagnostics and correlations for complex performance analysis
- View WebSphere performance in an application context
Metrics for WebSphere Server
- System CPU Usage & Process CPU Usage
- Uptime
- Max Memory
- Heap Size & Max Heap Dumps on Disks
- Java Vendor & Version
- Used Memory, Free Memory & Used Memory Percent
- JVM Memory
- Max Heap, Current Heap, Used Heap
- Live Sessions
- JDBC Providers: Open Count, Created, Pool Size, Used Pool, Use Time
- Thread Pools: Pool Size, Active Count, Growable indication, Inactivity Timeout & Max size
- Server Applications Sessions/Requests: Number of Sessions, Servlets, Total Requests, Current Requests, Avg. Response Time
- JSP Requests, JSP Response Time, Servlet Requests, Servlet Response Time, EJB Method Calls, EJB Response Time
- Component Detail
- Module Detail Totals for Charts & Tables
End-to-End Context for WebSphere
- Custom flow diagrams help visualize complex applications and WebSphere’s place in that architecture
- Provides an Intuitive View of How WebSphere Interacts with other Enterprise PaaS Components
- Designed and Developed for Large Scale, Mission Critical Environments
Get all the latest news and updates from RTView
Don’t worry you can unsubscribe at any time!
How is RTView a game-changer for your business?
RTView is the world’s highest performance and lowest
overhead solution designed specifically for
middleware monitoring.
These companies trust RTView TIBCO Monitoring®. You can too!





Need more answers?
Send us a message


