Oracle® Coherence Monitoring with RTView®
Real-time Intelligence for Distributed Data Grid Applications
Real-time Intelligence for Distributed Data Grid Applications

Oracle Coherence is the industry’s leading in-memory distributed data grid solution, enabling companies to exploit large clusters of caching servers on top of a reliable, highly scalable peer-to-peer network. Applications that are designed to exploit the power and performance of Coherence are often the most critical and valuable in the enterprise applications portfolio. Therefore, systems downtime or lapses in performance can have costly or even disastrous consequences.
The Solution Package for Oracle Coherence was designed to extend the real-time visibility and advanced diagnostic capabilities of RTView® deeper into Oracle Coherence environments.
RTView® Enterprise Edition and the Solution Package for Oracle Coherence are lightweight, scalable, and easy to install and configure. Data is collected, analyzed and presented in real-time without the latency associated with database-centric monitoring systems.
The RTView Solution Package for Oracle Coherence Monitor provides real-time responsiveness and insight beyond the capabilities of Oracle’s native tools.
The Solution Package for Oracle Coherence presents a complete picture of your Coherence cluster configuration including both physical and logical resources. Important configuration information includes physical resources like hosts, nodes (JVMs), memory, CPU, threads, etc. The Solution Package for Oracle Coherence also reports on Coherence-specific logical resources. These include the cluster service and its current membership, member roles, the distributed and replicated cache services, the caches and cache configurations associated with those services, and the number of objects in each cache.
The Solution Package for Oracle Coherence presents a complete picture of your Coherence cluster configuration including both physical and logical resources. Important configuration information includes physical resources like hosts, nodes (JVMs), memory, CPU, threads, etc. The Solution Package for Oracle Coherence also reports on Coherence-specific logical resources. These include the cluster service and its current membership, member roles, the distributed and replicated cache services, the caches and cache configurations associated with those services, and the number of objects in each cache.
Cluster activity and workload are monitored for all services and service types. The information is presented in real-time and persisted to the RTView Historian, so both short- and long-term trends may be easily analyzed from the same interface. In Coherence, performance data is usually reported at the service level (messages, requests and pending requests, task backlog, threads and abandoned threads, etc.). Workload (puts and gets, evictions and expiry, database stores and store failures, etc.) is reported at the cache level.
Cluster activity and workload are monitored for all services and service types. The information is presented in real-time and persisted to the RTView Historian, so both short- and long-term trends may be easily analyzed from the same interface. In Coherence, performance data is usually reported at the service level (messages, requests and pending requests, task backlog, threads and abandoned threads, etc.). Workload (puts and gets, evictions and expiry, database stores and store failures, etc.) is reported at the cache level.
Hotspots, bottlenecks and latency in Coherence are depicted in innovative History Heatmap displays that show holistic cluster behavior over time as rows of light and dark squares. Each row is a trend chart representing something about a physical or logical resource. By stacking these together, you can see periodic patterns in the cluster. Users can mouse over the squares to see the underlying metrics. History Heatmaps allow users to see trends in internal Coherence load balancing of cluster activity and resource usage.
Hotspots, bottlenecks and latency in Coherence are depicted in innovative History Heatmap displays that show holistic cluster behavior over time as rows of light and dark squares. Each row is a trend chart representing something about a physical or logical resource. By stacking these together, you can see periodic patterns in the cluster. Users can mouse over the squares to see the underlying metrics. History Heatmaps allow users to see trends in internal Coherence load balancing of cluster activity and resource usage.
Issues and problems are represented through alerts which are centralized in a single view. Through the use of intelligent control rules, simple and complex thresholds can be established using historical data. Thresholds can be variable at runtime to provide greater control and reduction of noise at peak operating times or during testing. Advanced filtering enables specific application owners and support teams to only view the events that impact their applications.
These rules and thresholds can be applied globally across many instances of the technology or overridden for a specific instance when there are special cases that need to be handled. Rules can be identified specifically for roles in your organization.
Coherence is frequently a component in critical business applications where operations staffs need proactive monitoring so fault conditions may be addressed before users are affected. The Solution Package for Oracle Coherence includes 18 pre-defined alerts to identify the most important cluster failure and performance degradation conditions. Most of these alerts involve cluster-wide analytics.
Many problems in individual nodes are transient and do not require intervention, whereas problems in the cluster as a whole should be addressed immediately.
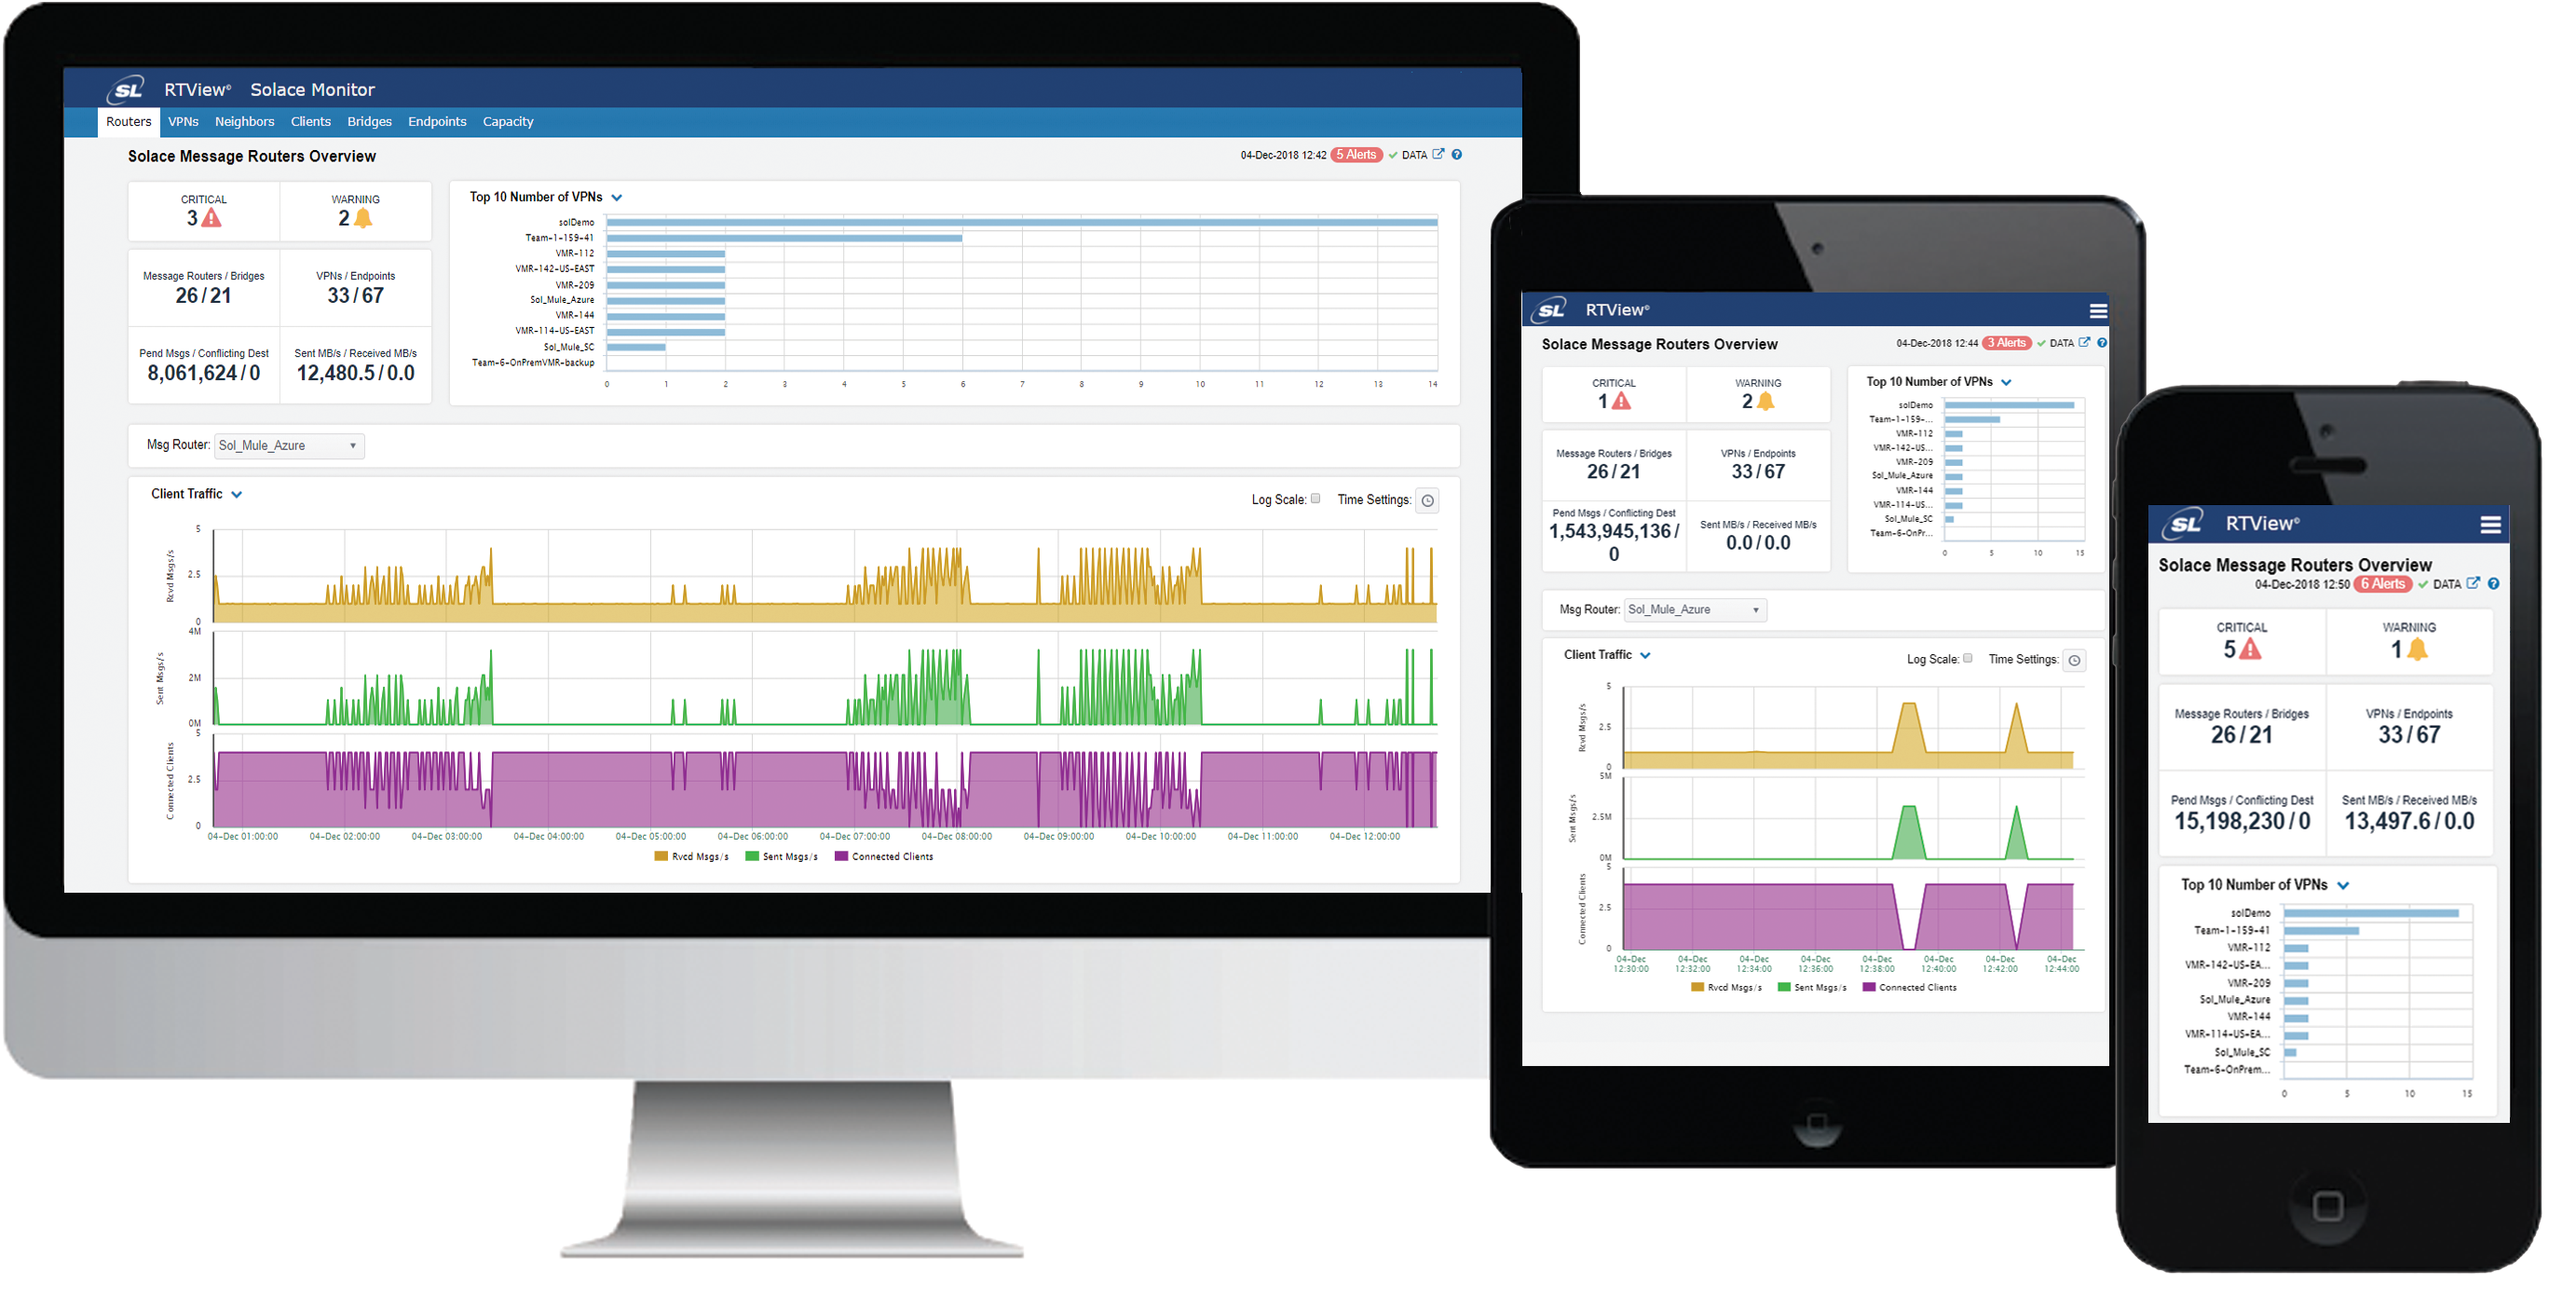
Like Coherence itself, the RTView and its Solution Packages are written in Java and operate in memory. They are lightweight, flexible, and easy to install and configure. To view Coherence monitoring data, RTView provides multiple display and reporting clients available for use out-of-the-box. A Java desktop and a web browser client provide remote access to any device including smartphones, tablets and other thin clients.
Like Coherence itself, the RTView and its Solution Packages are written in Java and operate in memory. They are lightweight, flexible, and easy to install and configure. To view Coherence monitoring data, RTView provides multiple display and reporting clients available for use out-of-the-box. A Java desktop and a web browser client provide remote access to any device including smartphones, tablets and other thin clients.
Instantly Assess Health and Status of the Entire Coherence Cluster by allowing you to visualize potential performance bottlenecks in real-time as well as through historical trend analysis so that they can be addressed proactively.
View Coherence Operations at the Clusters, Application and PaaS Level by taking advantage of the real-time, end-to-end monitoring and diagnostic capabilities of RTView® Enterprise Edition.
Anticipate and Avoid Downtime, Hotspots, and Bottlenecks by moving from reactive monitoring to proactive monitoring, identifying problems before they become critical and impact overall application performance.
Adds Significant Value in Development, Test, and Production by providing a “single pane of glass” to all your application infrastructure components, support personnel can quickly drill down to the source of problems without having to use multiple monitoring tools managed by different groups.
Lower Cost of Development and Operations by ensuring that developer and support groups have Coherence insights integrated with views for Oracle (WebLogic, Database), IBM (Websphere, DB2), TIBCO, VMware and more.
Rapid time to Value with Minimal Training Requirement for Business and Technical Users. The intuitive user interface means that users can gain immediate insight and make continuous progress in understanding and diagnosing their most critical custom applications.
The Solution Package for Oracle Coherence is a targeted set of monitoring and diagnostic views of Oracle Coherence environments that extend the end-to-end monitoring capabilities of our flagship product RTView® Enterprise Edition. Together, these products provide a complete, real-time view of what is going on throughout a Coherence data grid environment, as well as how that environment interacts and correlates with other components at the application or the platform level.
This ensures that developers, testers, and applications support professionals get the right information in exactly the right context to make the most effective design, diagnostic operational decisions for Oracle Coherence Environments.
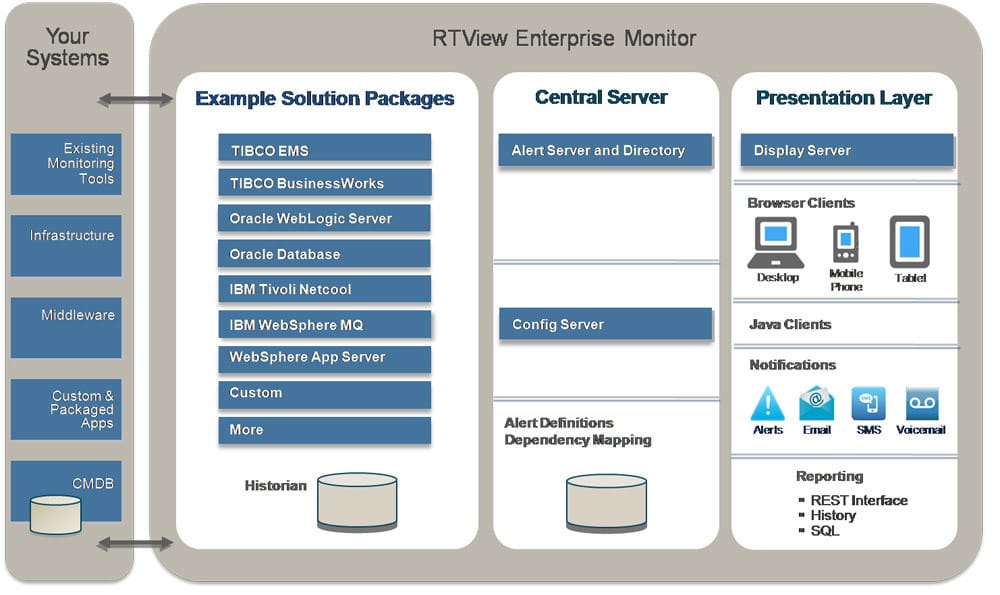
Built upon the underlying RTView real-time platform, the Solution Package for Oracle Coherence provides multiple distributed deployment architecture options. Multiple, geographically dispersed clusters can be monitored and managed from a central location by deploying an RTView Data Server locally for each cluster. Optional display, reporting or historian clients may be deployed remotely to monitor the health and status of any or all of the clusters.
Because RTView also tracks other Oracle components (Database, WebLogic) and non-Oracle software (TIBCO, IBM, Open Source, et al), developers, architects, app owners, and app support teams get a true end-to-end view of their most critical and valuable custom applications.


