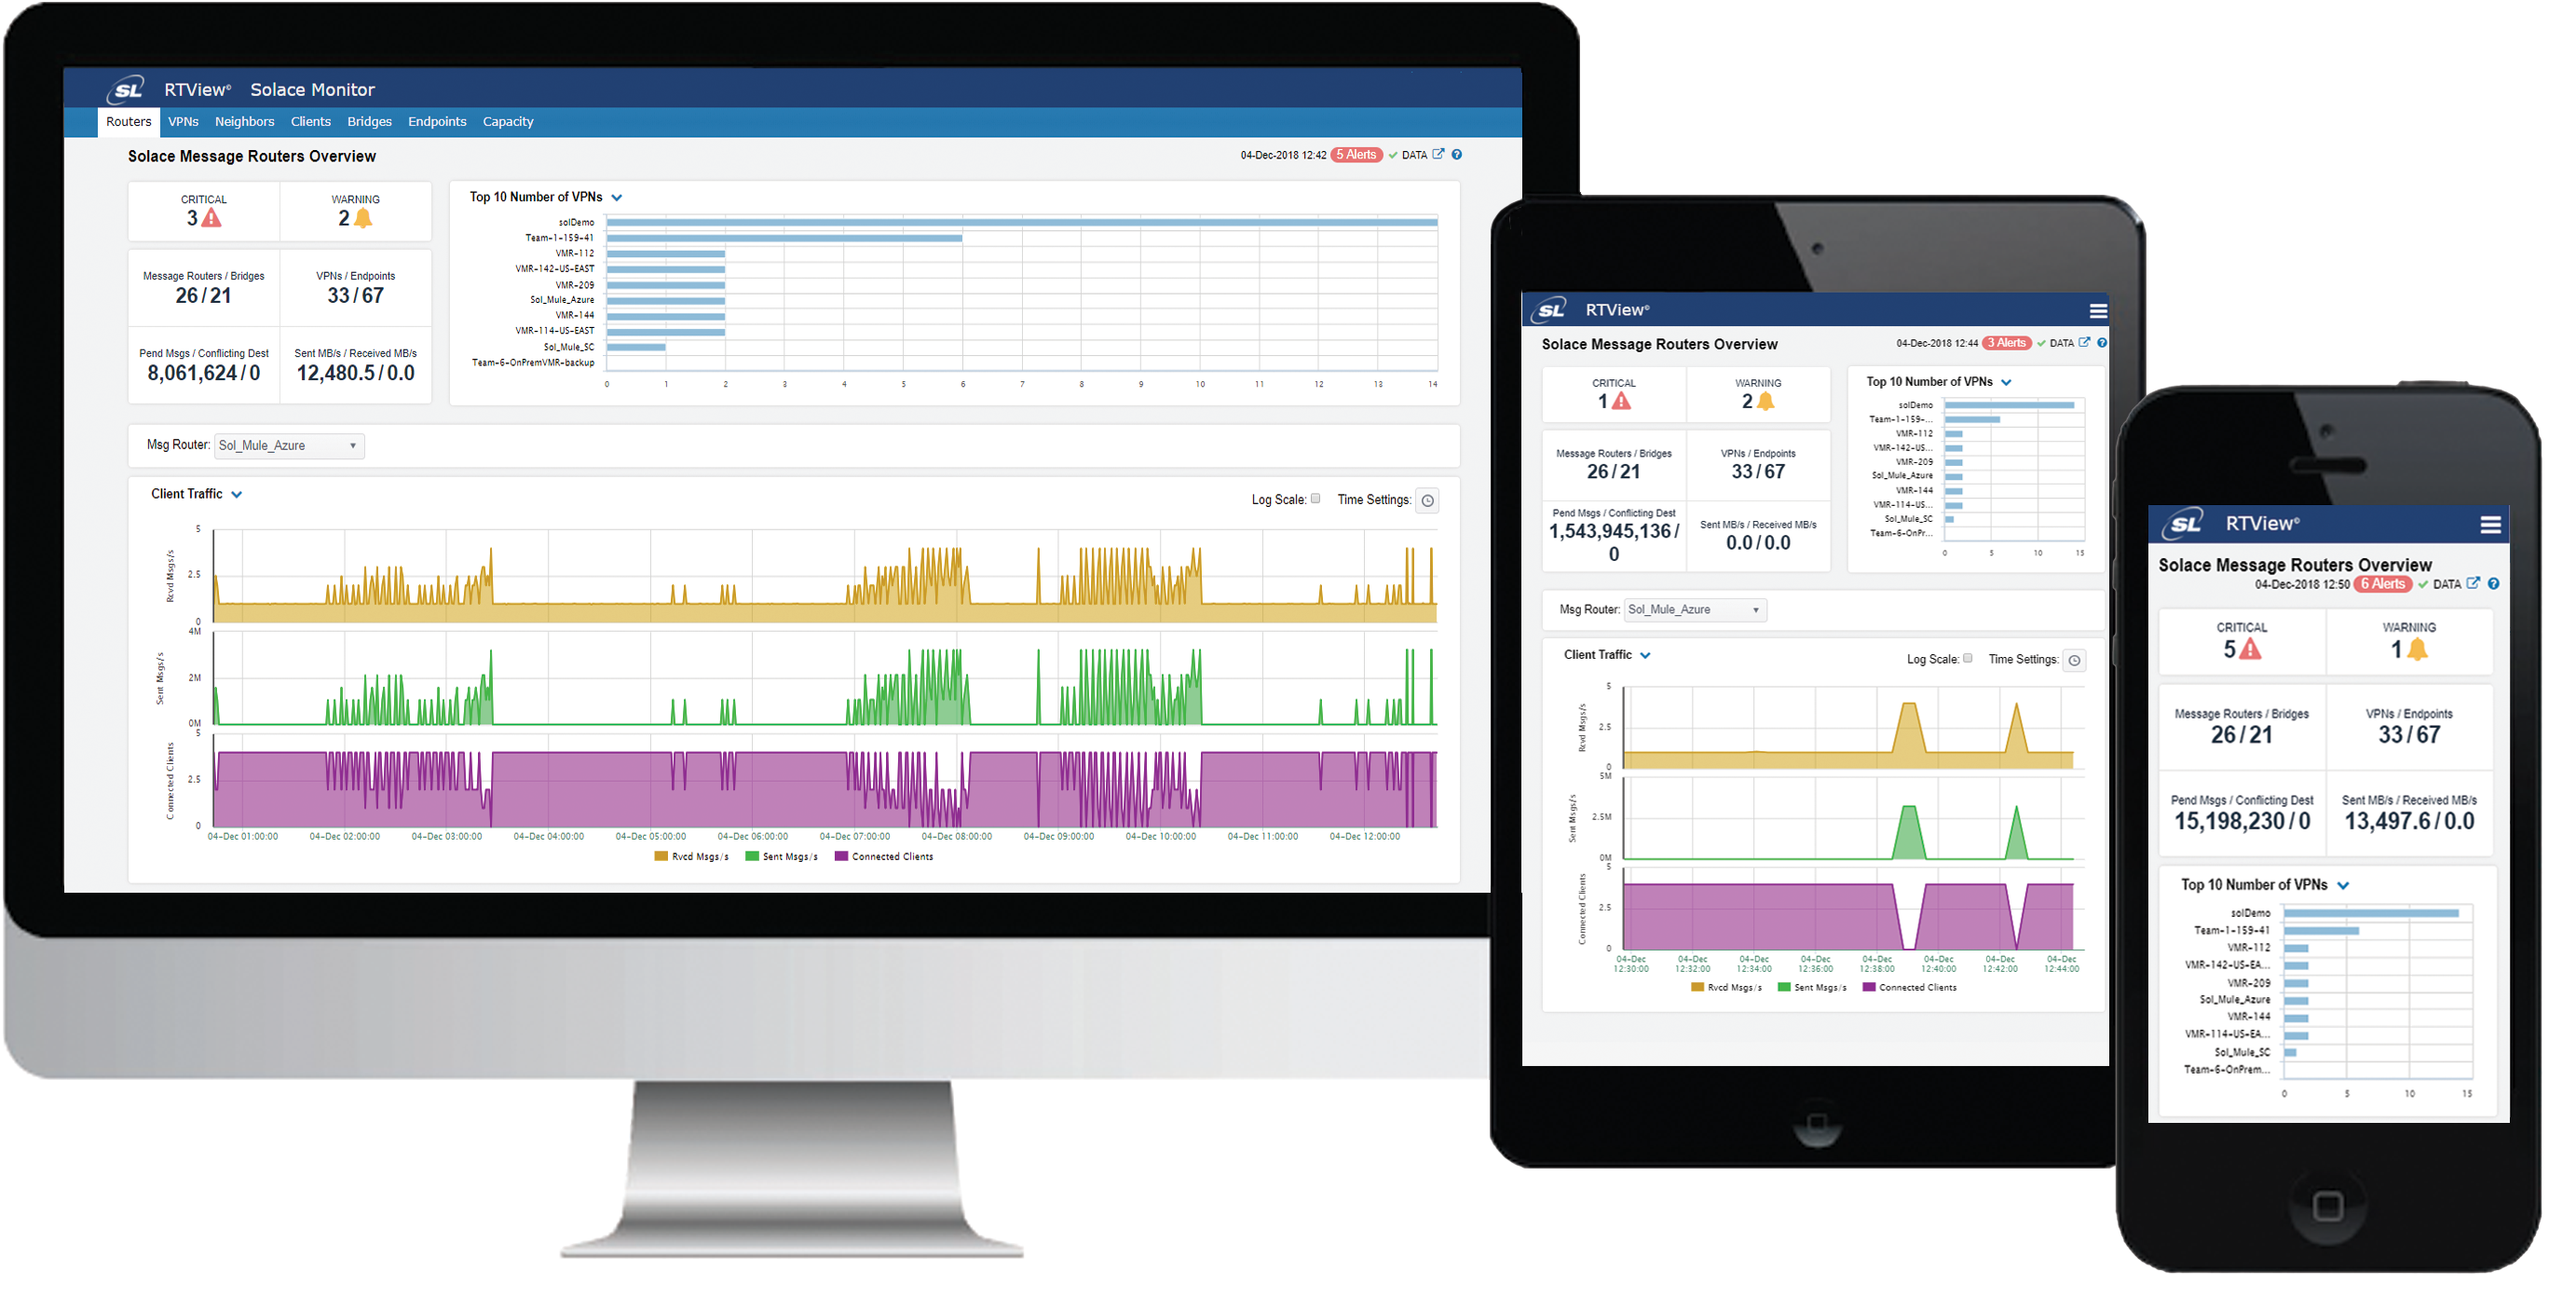
The Connector for Oracle Enterprise Manager (OEM) allows RTView® Enterprise Edition to connect to existing deployments of OEM and collect performance data for databases and hosts (physical servers) that have been designated as OEM targets.
When paired with our Oracle Database and Host Monitor Solution Packages, these performance metrics are then stored in the RTView® Enterprise Edition caches and available for summary views detailing the health of your OEM managed hosts and databases, including drill down views, correlation with services and other technologies, historical analysis, capacity planning and alert management.
Extend OEM Value to Operations and Application Support Teams
While OEM is most often used by Database and Oracle support teams for managing database deployments and monitoring, RTView® Enterprise Edition is used for Operations and Application Support teams, providing an end-to-end view of heterogeneous environments and how the health of multiple resources and supporting technologies affect the performance and availability of services and applications.
View Aggregated Host Information from OEM Managed Hosts
RTView® Enterprise Edition can incorporate and normalize the host data, such as CPU and memory consumption, coming from disparate host monitoring solutions, including OEM for Oracle deployments, so that the physical resources of your entire organization can be viewed together and show how the health of these resources are affecting the performance of services or supporting technologies.
Display Database Alerts Most Useful to Operations and Application Support Teams
RTView® Enterprise Edition allows Operations and Application Support staff to eliminate much of the “noise” found in most OEM environments by choosing only the alert events that indicate a situation that would directly affect the availability or performance of their services. For example, read or write rates that are too high, connection failures, deadlocks, or high space usage, which might immediately affect or endanger the performance of their services.
Once a situation has been identified within RTView® Enterprise Edition , users can then immediately see the associated services that soon may be affected and drill down to correlation and historical analysis screens which can identify the trends and potential failure points for the database.
Get all the latest news and updates from RTView
Don’t worry you can unsubscribe at any time!
How is RTView a game-changer for your business?
RTView is the world’s highest performance and lowest
overhead solution designed specifically for
middleware monitoring.
These companies trust RTView TIBCO Monitoring®. You can too!




Need more answers?
Send us a message
