Oracle® WebLogic Monitoring with RTView®
End-to-End Visibility for WebLogic Powered Applications
End-to-End Visibility for WebLogic Powered Applications

Oracle WebLogic has long been a leading player in the Enterprise Application Server market and is a mainstay of many Oracle-powered IT organizations and projects. For many enterprise IT organizations and development shops it is a permanent part of their application runtime environments as well as a key component in their construction of a standard Platform as a Service (PaaS).
With its broad use in distributed, N-tier applications and its architectural organization into clusters and domains it is often a challenge to understand and diagnose the performance and resource consumption of these complex runtime environments. While the WebLogic console and Oracle Enterprise Manager provide excellent tools for managing at the server or domain level, Dev Ops managers and IT Applications Support professionals sometimes struggle to monitor and diagnose larger, multi-domain installations that may contain hundreds or thousands of nodes.
The Solution Package for WebLogic was designed and developed to provide enterprise developers, application architects and IT operations professionals powerful diagnostics capabilities and real-time insight into large-scale WebLogic environments.
Within seconds enterprise developers and applications support teams can navigate through the WebLogic runtime environment from the broadest view of the environment to a precise drill down to the individual WebLogic server instance.
Within seconds enterprise developers and applications support teams can navigate through the WebLogic runtime environment from the broadest view of the environment to a precise drill down to the individual WebLogic server instance.
Within minutes of installation the Solution Package for Oracle WebLogic presents intuitive views of WebLogic metrics such as heap, sockets, threads, CPU usage, queues, JDBC performance, sessions, invocations and execution time.
Within minutes of installation the Solution Package for Oracle WebLogic presents intuitive views of WebLogic metrics such as heap, sockets, threads, CPU usage, queues, JDBC performance, sessions, invocations and execution time.
Application developers and App Support teams must solve complex and often deceptive performance challenges that can lead to application downtime, brown-outs and erratic behaviors. The Solution Package for Oracle WebLogic can provide insights to diagnose tough challenges like:
Application developers and App Support teams must solve complex and often deceptive performance challenges that can lead to application downtime, brown-outs and erratic behaviors. The Solution Package for Oracle WebLogic can provide insights to diagnose tough challenges like:
While developers and application support teams want to have technical detail and a good understanding of how their WebLogic components are operating, it is also important and valuable to assess how the WebLogic subsystem affects performance and resource consumption at the application level. RTView® provides both the detailed technical intelligence for their WebLogic runtime and a holistic view of how WebLogic operation affects the application as a whole.
While developers and application support teams want to have technical detail and a good understanding of how their WebLogic components are operating, it is also important and valuable to assess how the WebLogic subsystem affects performance and resource consumption at the application level. RTView® provides both the detailed technical intelligence for their WebLogic runtime and a holistic view of how WebLogic operation affects the application as a whole.
Applications Support teams can quickly assess available resources and avoid bottlenecks and outages. The Solution Package for Oracle WebLogic can provide insights to understand resource utilization questions like:
Applications Support teams can quickly assess available resources and avoid bottlenecks and outages. The Solution Package for Oracle WebLogic can provide insights to understand resource utilization questions like:
Oracle WebLogic is increasingly found as part of a standardized Enterprise PaaS. With developer and IT ops professionals awash in different administrative and management interfaces, the intuitive end-to-end RTView monitoring interface provides a consistent, scalable view into even the largest application architectures.
When used in conjunction with an established Service Model, it enables understanding of how WebLogic performance issues affect the overall health and response time of the business application as a whole.
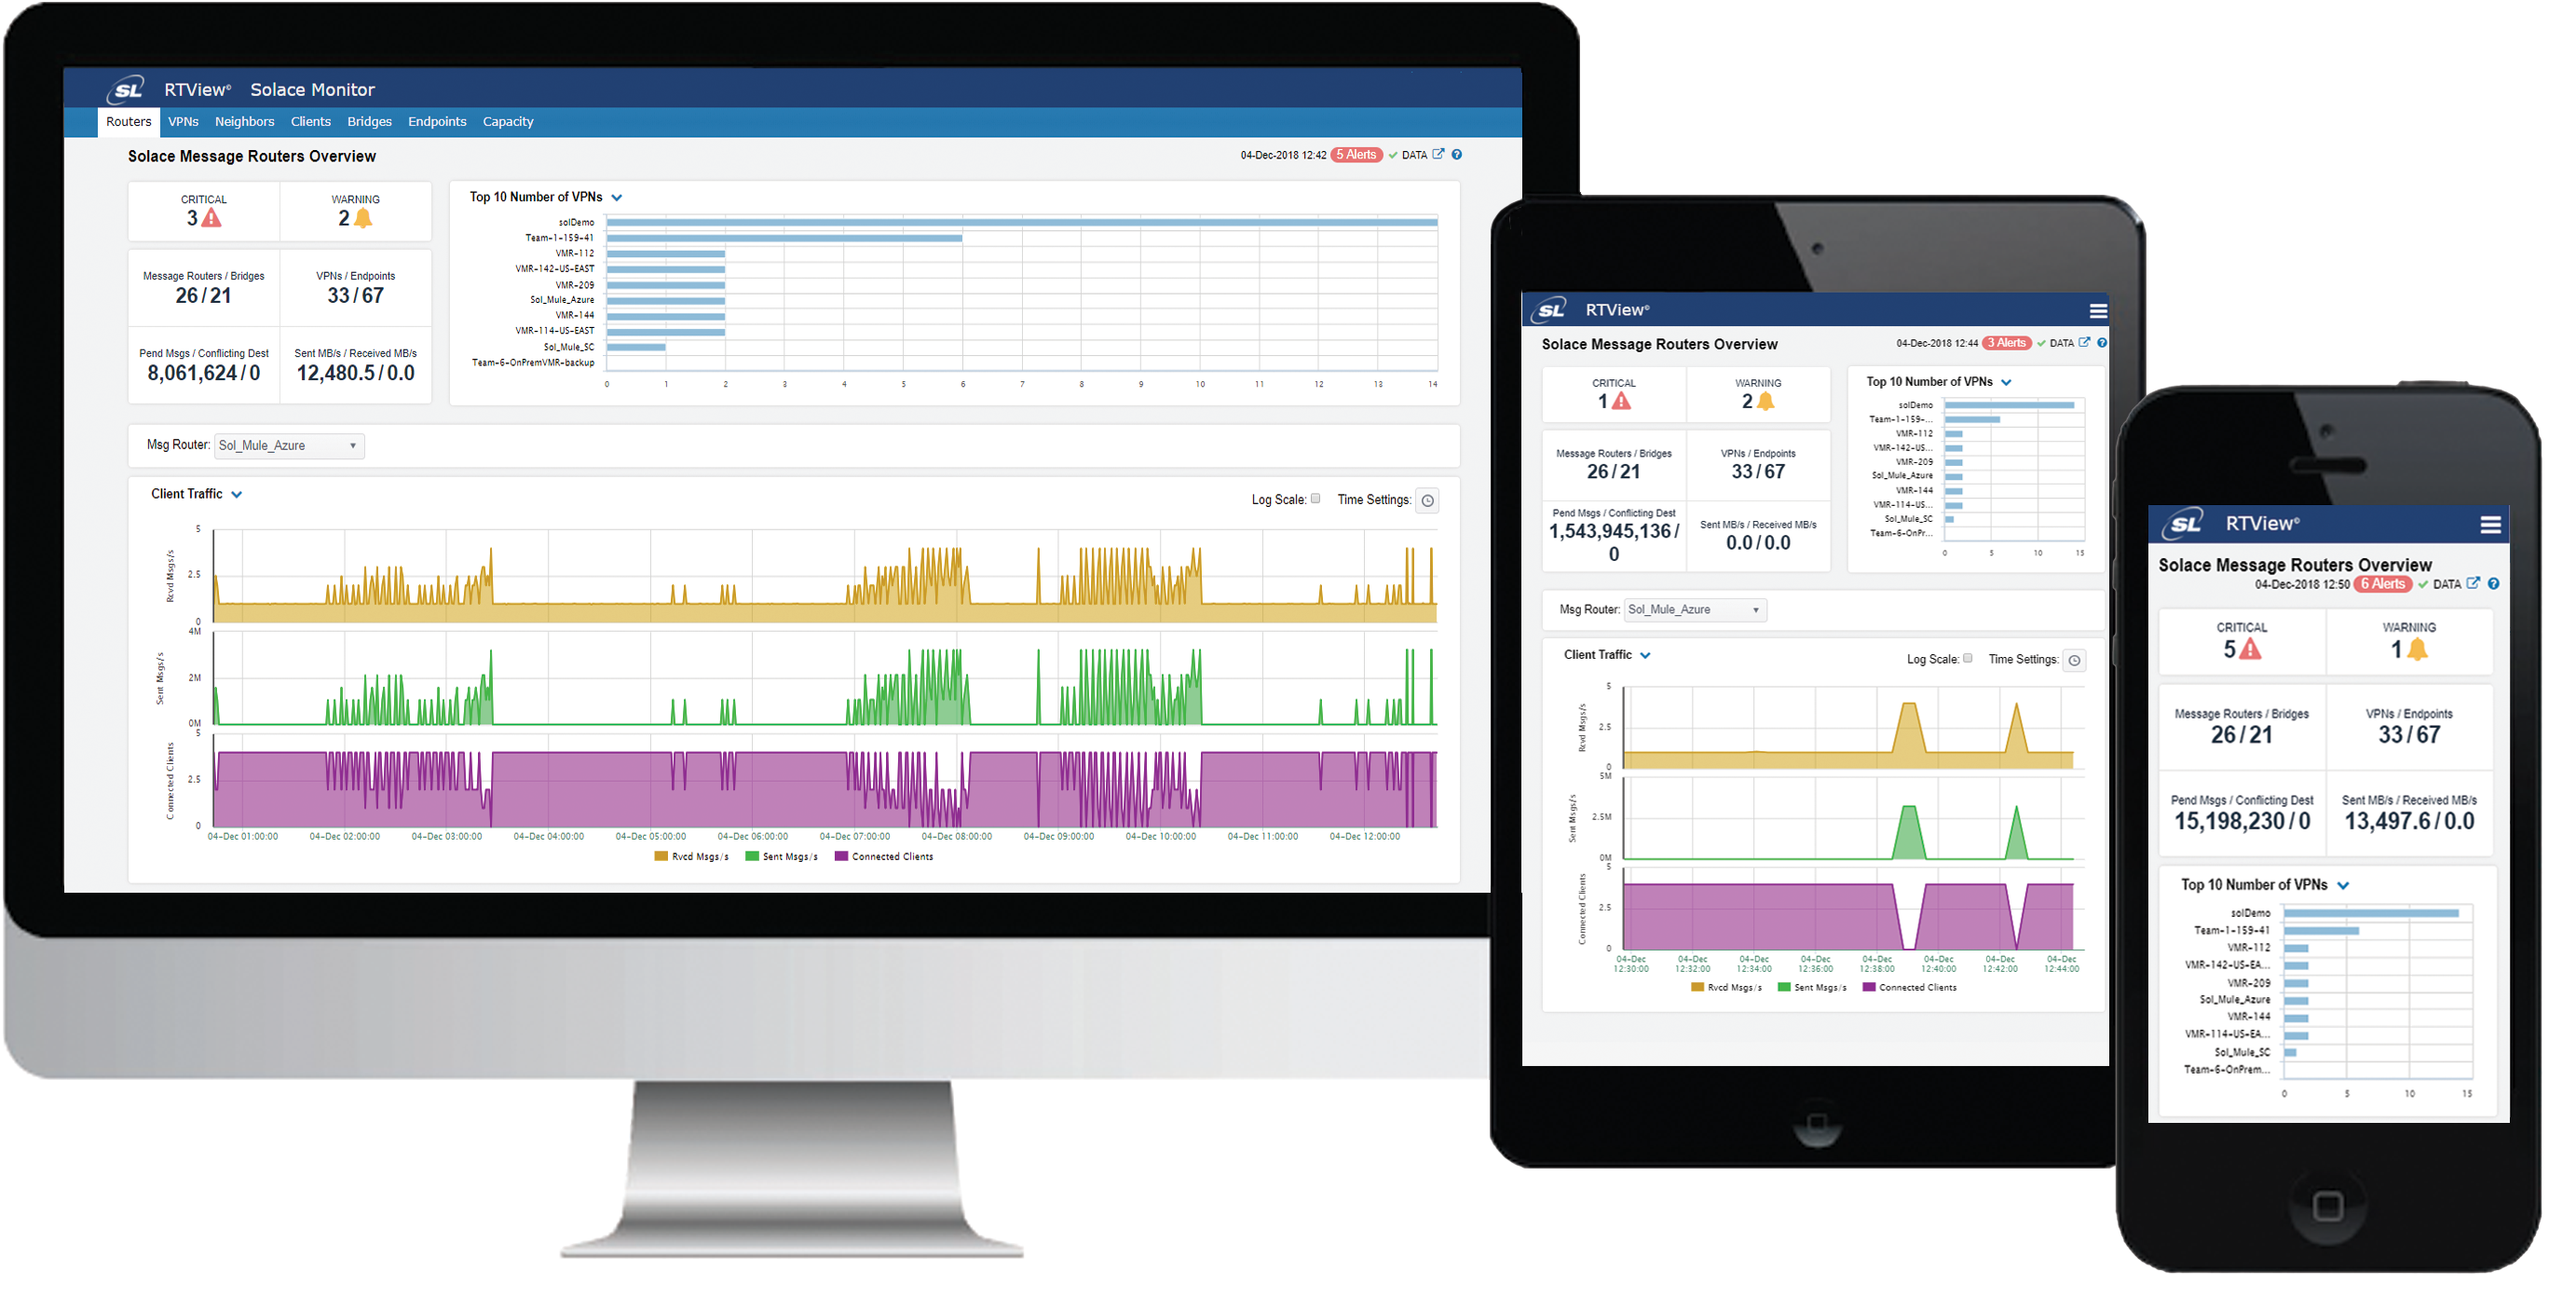
With today’s mobile workforce, even IT professionals need to get a view of their online world in any location from any device. Because RTView and Solution Packages are written in Java, users are able to take all of their insights with them. RTView users can also quickly and easily share diagnostic views with other team members by sharing URLs or easily designing custom views for business or technical users.
With today’s mobile workforce, even IT professionals need to get a view of their online world in any location from any device. Because RTView and Solution Packages are written in Java, users are able to take all of their insights with them. RTView users can also quickly and easily share diagnostic views with other team members by sharing URLs or easily designing custom views for business or technical users.
Instantly Assess Health and Status of the Entire Coherence Cluster by allowing you to visualize potential performance bottlenecks in real-time as well as through historical trend analysis so that they can be addressed proactively.
View Coherence Operations at the Clusters, Application and PaaS Level by taking advantage of the real-time, end-to-end monitoring and diagnostic capabilities of RTView® Enterprise Edition.
Anticipate and Avoid Downtime, Hotspots, and Bottlenecks by moving from reactive monitoring to proactive monitoring, identifying problems before they become critical and impact overall application performance.
Adds Significant Value in Development, Test, and Production by providing a “single pane of glass” to all your application infrastructure components, support personnel can quickly drill down to the source of problems without having to use multiple monitoring tools managed by different groups.
Lower Cost of Development and Operations by ensuring that developer and support groups have Coherence insights integrated with views for Oracle (WebLogic, Database), IBM (Websphere, DB2), TIBCO, VMware and more.
Rapid time to Value with Minimal Training Requirement for Business and Technical Users. The intuitive user interface means that users can gain immediate insight and make continuous progress in understanding and diagnosing their most critical custom applications.
The Solution Package for Oracle Coherence is a targeted set of monitoring and diagnostic views of Oracle Coherence environments that extend the end-to-end monitoring capabilities of our flagship product RTView® Enterprise Edition. Together, these products provide a complete, real-time view of what is going on throughout a Coherence data grid environment, as well as how that environment interacts and correlates with other components at the application or the platform level.
This ensures that developers, testers, and applications support professionals get the right information in exactly the right context to make the most effective design, diagnostic operational decisions for Oracle Coherence Environments.
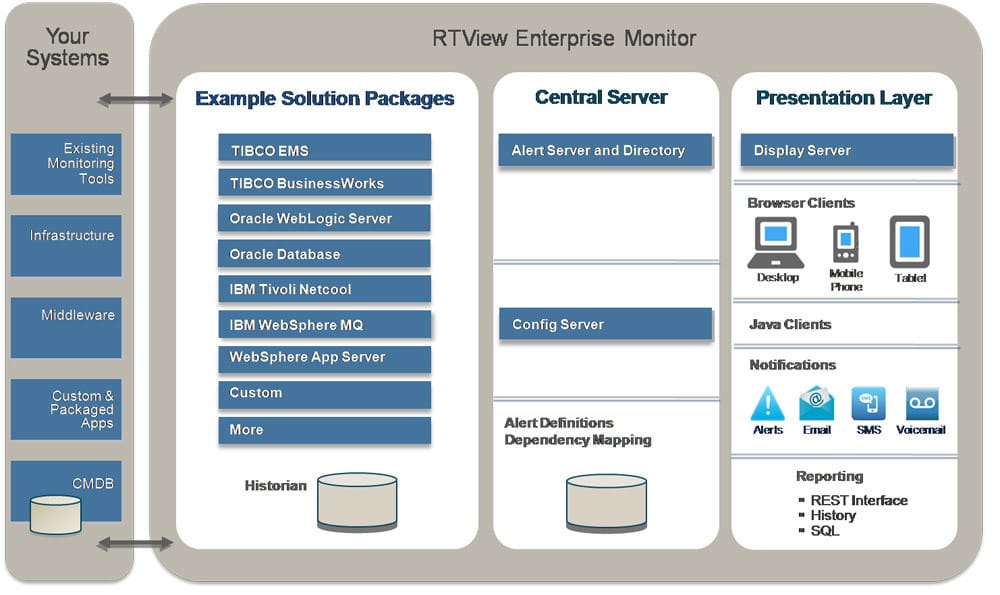
Built upon the underlying RTView real-time platform, the Solution Package for Oracle Coherence provides multiple distributed deployment architecture options. Multiple, geographically dispersed clusters can be monitored and managed from a central location by deploying an RTView Data Server locally for each cluster. Optional display, reporting or historian clients may be deployed remotely to monitor the health and status of any or all of the clusters.
Because RTView also tracks other Oracle components (Database, WebLogic) and non-Oracle software (TIBCO, IBM, Open Source, et al), developers, architects, app owners, and app support teams get a true end-to-end view of their most critical and valuable custom applications.


