RTView’s Solution Package for TIBCO FTL monitoring provides visibility into your TIBCO FTL deployments across the globe so that you can proactively monitor performance degradation trends and traffic spikes. Rapidly respond to real-time alerts and correlate performance across TIBCO and non-TIBCO infrastructure to quickly find the source of problems and fix them before they happen again.
RTView’s Solution Package for TIBCO FTL monitoring provides visibility into your TIBCO FTL deployments across the globe so that you can proactively monitor performance degradation trends and traffic spikes. Rapidly respond to real-time alerts and correlate performance across TIBCO and non-TIBCO infrastructure to quickly find the source of problems and fix them before they happen again.
Monitor TIBCO FTL Servers
All FTL Servers Heatmap
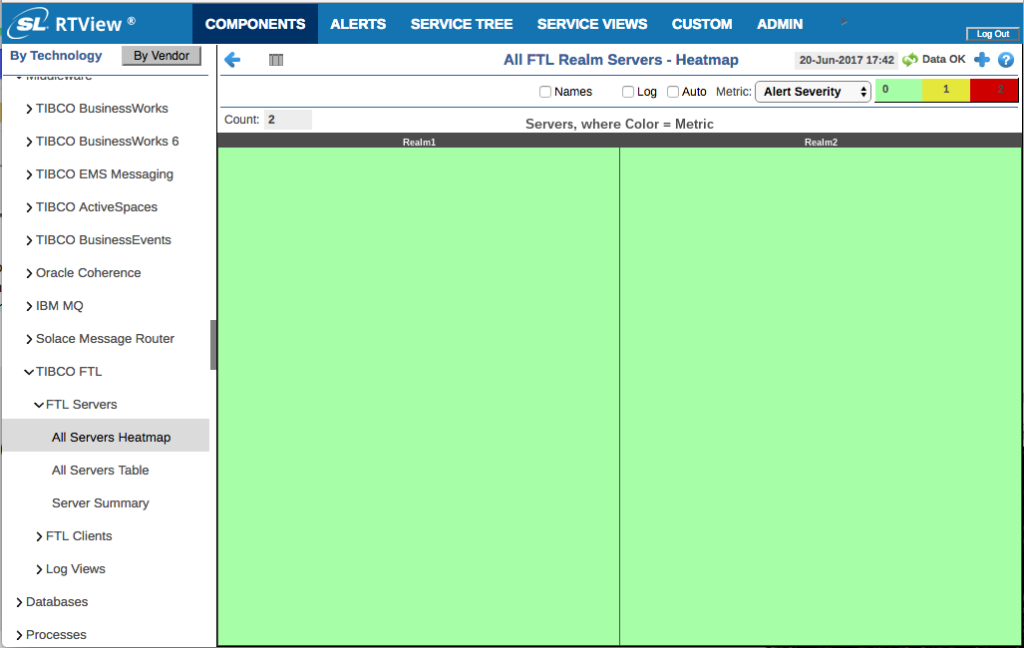
The All FTL Servers heatmap provides instant visual feedback into the health and performance of your FTL servers.
Color intensity can be mapped to: Alert Severity, Alert Count, # Clients, Delta CPU, Memory, Virtual Memory, or # Inbox Faults.
Mouse-over details: Connection, Alert Severity, Alert Counts, State, Delta CPU, Process Memory, Process VM, Inbox Send Faults, Client Count, and Client Exceptions.
Click-through to drill-down to Single FTL Server Summary.
All Servers Table
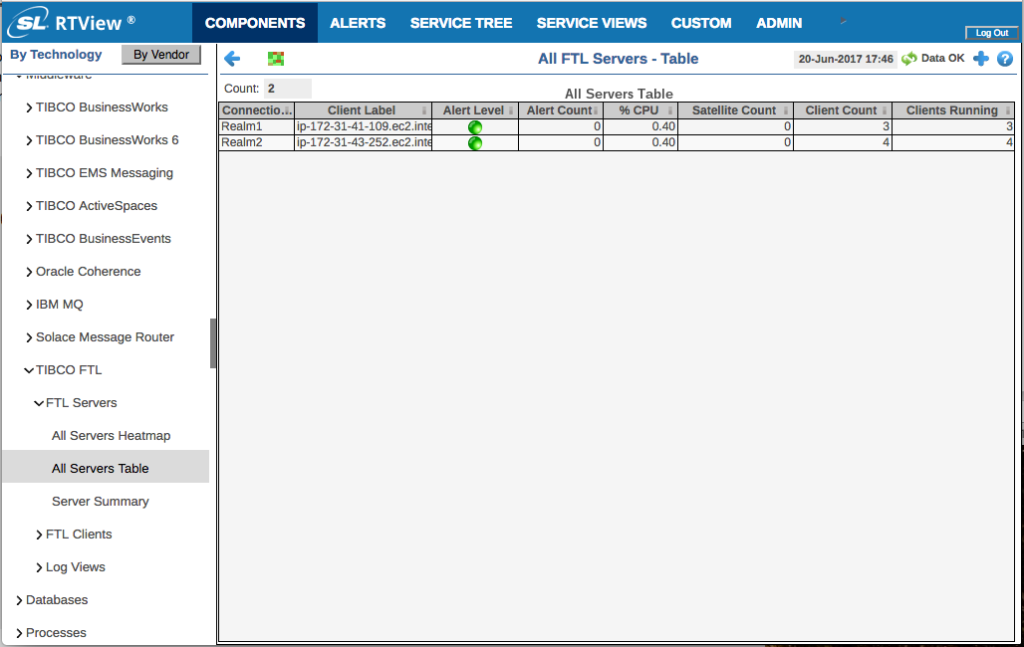
This simple table provides much more information than the heatmap for when you are really trying to figure out which FTL server you want to focus in on. Scroll right for deep insight.
Metrics include: Connection, Client Label, Alert Level, Alert Count, % CPU, Satellite Count, Client Count, Clients Running, Cumulative Client Connects, Process Peak RSS (KB), Process RSS (KB), Inbox Send Faults, User CPU Time, System CPU Time, Clients Destroyed, Client Exceptions, Clients Needing Restart, Clients Off-line, Clients Out of Sync, Client Reconnects, Client Time-outs, Current Realm Server, Primary Realm Server, Backup Realm Server, Server ID, Uptime, Version, State, Data Timestamp, Timestamp.
Single FTL Server Summary
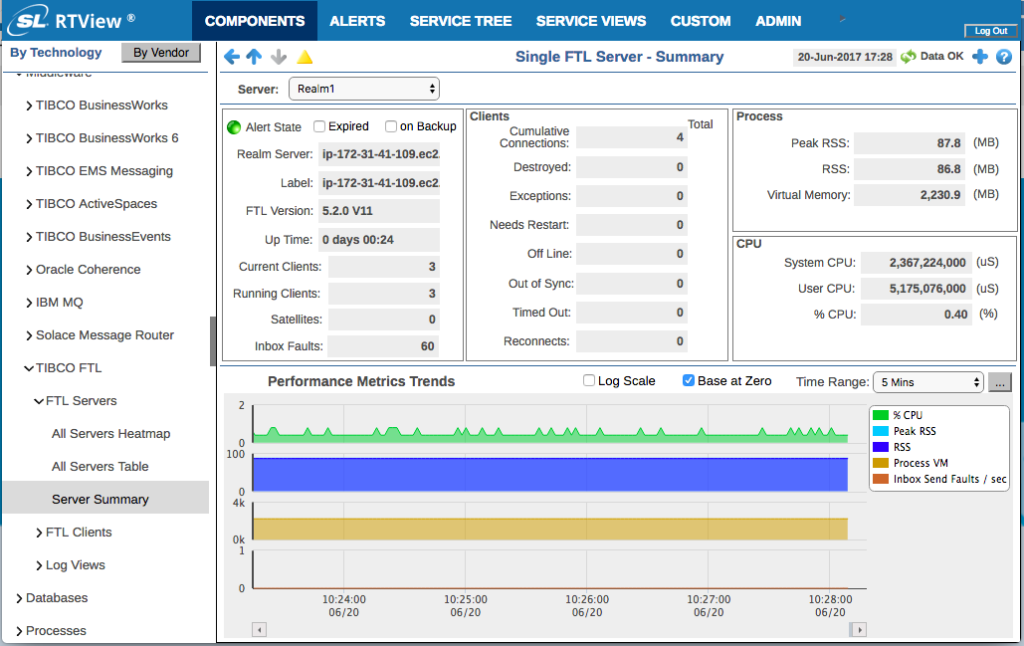
Detailed server metrics are provided for a complete picture of FTL Server health. This summary is one drill-down click away from the All FTL Servers heatmap and table. Metrics include:
Server: State, ID, Lable, Version, Up Time, Current Clients, Running Clients, Satellites, Inbox Faults
Clients: Cumulative Connections, Destroyed, Exceptions, Needs Restart, Off Line, Out of Sync, Timed Out, Reconnects
Process: RSS, Peak RSS, Virtual Memory
CPU: System CPU, User CPU, % CPU
Historical Performance Metrics Trends (up to last 7 days): % CPU, Peak RSS, RSS, Process VM, Inbox Send Faults/sec
Get all the latest news and updates from RTView
Don’t worry you can unsubscribe at any time!
Monitor TIBCO FTL Clients
All FTL Clients Heatmap
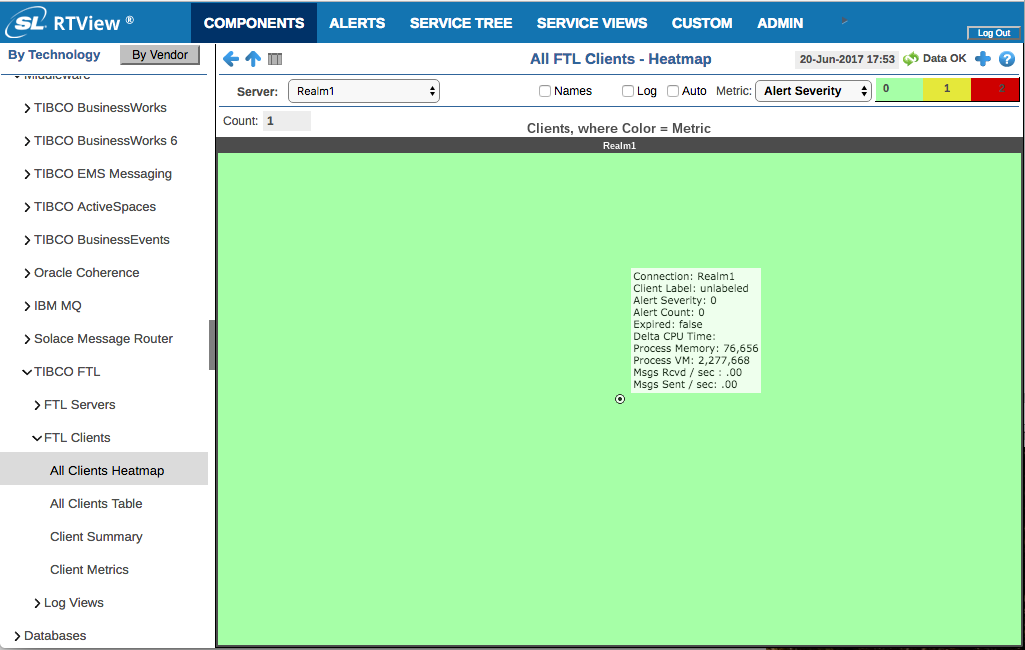
The All FTL Servers heatmap provides instant visual feedback into the health and performance of your FTL clients.
Color intensity can be mapped to: Alert Severity, Alert Count, Delta CPU, Memory, Virtual Memory, Msgs Rcvd/sec, Msgs Sent/sec
Mouse-over details: Connection, Client Label, Alert Severity, Alert Counts, State, Delta CPU Time, Process Memory, Process VM, Msgs Rcvd/sec, Msgs Sent/sec
Click-through to drill-down to Single FTL Client Summary.
All FTL Clients Table
This simple table provides much more information than the heatmap for when you are really trying to figure out which FTL clients you want to focus in on. Scroll right for deep insight.
Metrics include: Realm Server, Client, Alert Level, Alert Count, Client Status, % CPU, Process VM (KB), Process RSS (KB), Process Peak RSS (KB), Msgs Rcvd/sec, Msgs Zent/sec, Delta Msgs Rcvd, Delta Msgs Sent, Total Msgs Rcvd, Total Msgs Sent, Store Mismatch Msgs, Dynamic Formats, User CPU, System CPU, Application, Application Instance, Client ID, Process ID, FTL User, Effective User, Host, Host IP, FTL Version, State/Expired, Data Timestamp, Local Timestamp.
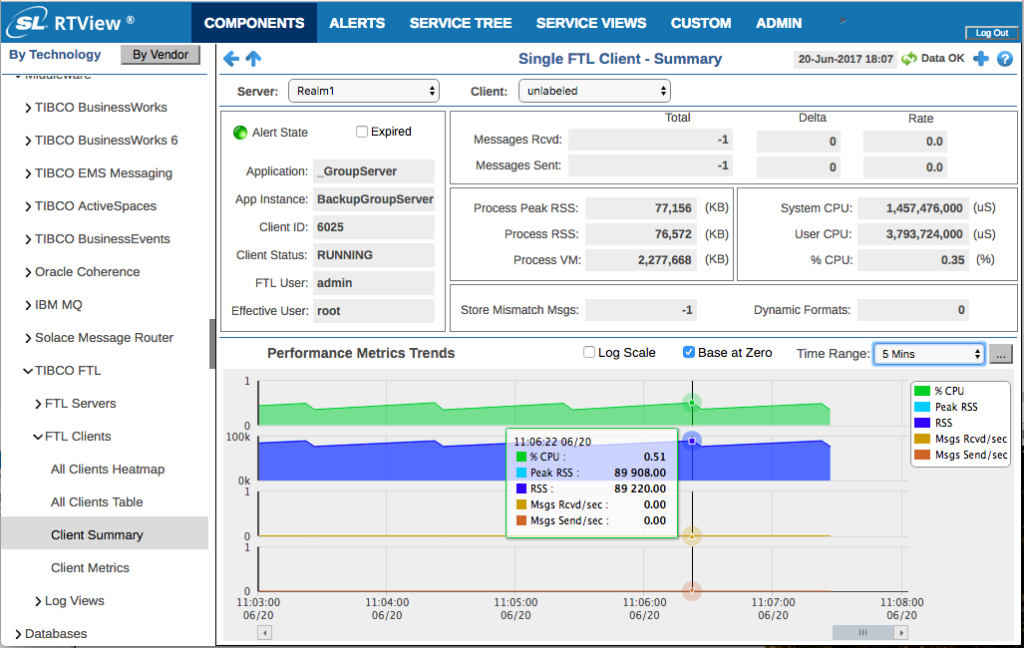
Single FTL Client Summary
Detailed client metrics are provided for a complete picture of FTL client health. This summary is one drill-down click away from the All FTL Client heatmap and table. Metrics include:
Server: Alert State, Expired State, Application Name, App Instance, Client ID, Client Status, FTL User, Effective User
Messages: Msgs Rcvd (total, delta & rate), Msgs Sent (total, delta & rate)
Process: RSS, Peak RSS, Virtual Memory
CPU: System CPU, User CPU, % CPU
Store: Mismatch Msgs, Dynamic Formats
Historical Performance Metrics Trends (up to last 7 days): % CPU, Peak RSS, RSS, Msgs Rcvd/sec, Msgs Sent/sec
World leader in real-time visualization and middleware monitoring since 1983
Real-time Alerts for TIBCO FTL Monitoring
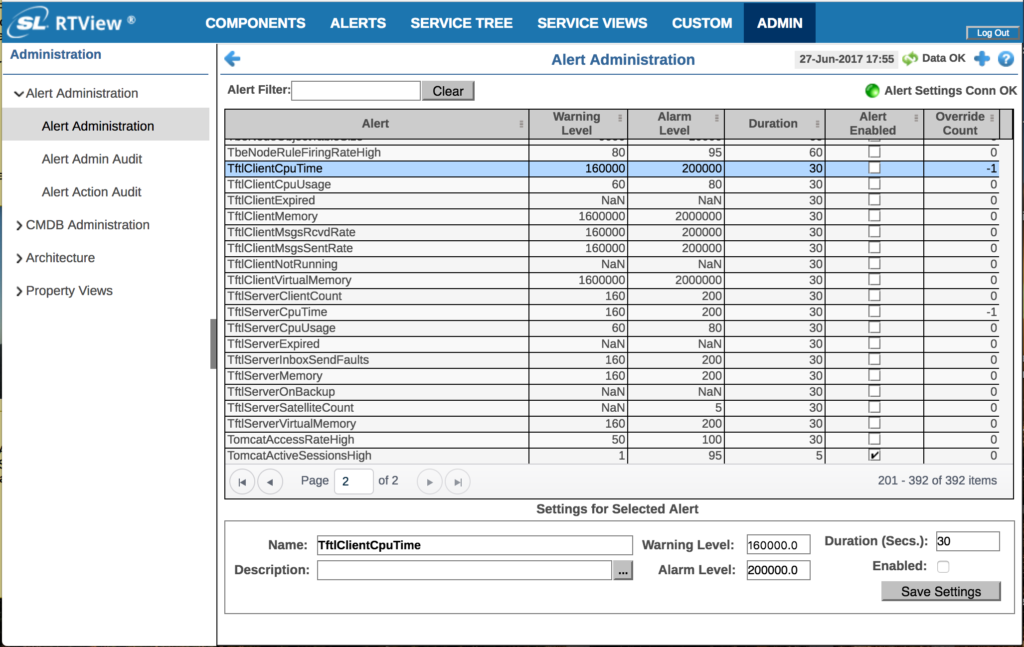
Alert Administration
RTView Solution Package for TIBCO FTL provides over a dozen pre-built alerts with pre-configured thresholds that can be enabled with a simple check box. Save time trying to figure out which alerts you want to create and start monitoring in less time.
Alerts: ClientCpuTime, ClientCpuUsage, ClientExpired, ClientMemory, ClientMsgsRcvdRate, ClientMsgsSentRate, ClientNotRunning, ClientVirtualMemory, ServerClientCount, ServerCpuTime, ServerCpuUsage, ServerExpired, ServerInboxSendFaults, ServerInboxSendFaults, ServerMemory, ServerOnBackup, ServerSatelliteCount, ServerVirtualMemory
How is RTView a game-changer for your business?
RTView is the world’s highest performance and lowest
overhead solution designed specifically for
middleware monitoring.
These companies trust RTView TIBCO Monitoring®. You can too!


Need more answers?
Send us a message


