RTView Enterprise 5.0 Featured Product Updates
OnApplication Monitoring, Blog, End to End Monitoring, Middleware Monitoring, Solace Monitoring, TIBCO Monitoring
Here’s what’s new in RTView Enterprise 5.0. These are featured updates, not a complete update list. For the complete list, please read the Release Notes.
New HTML 5 User Interface
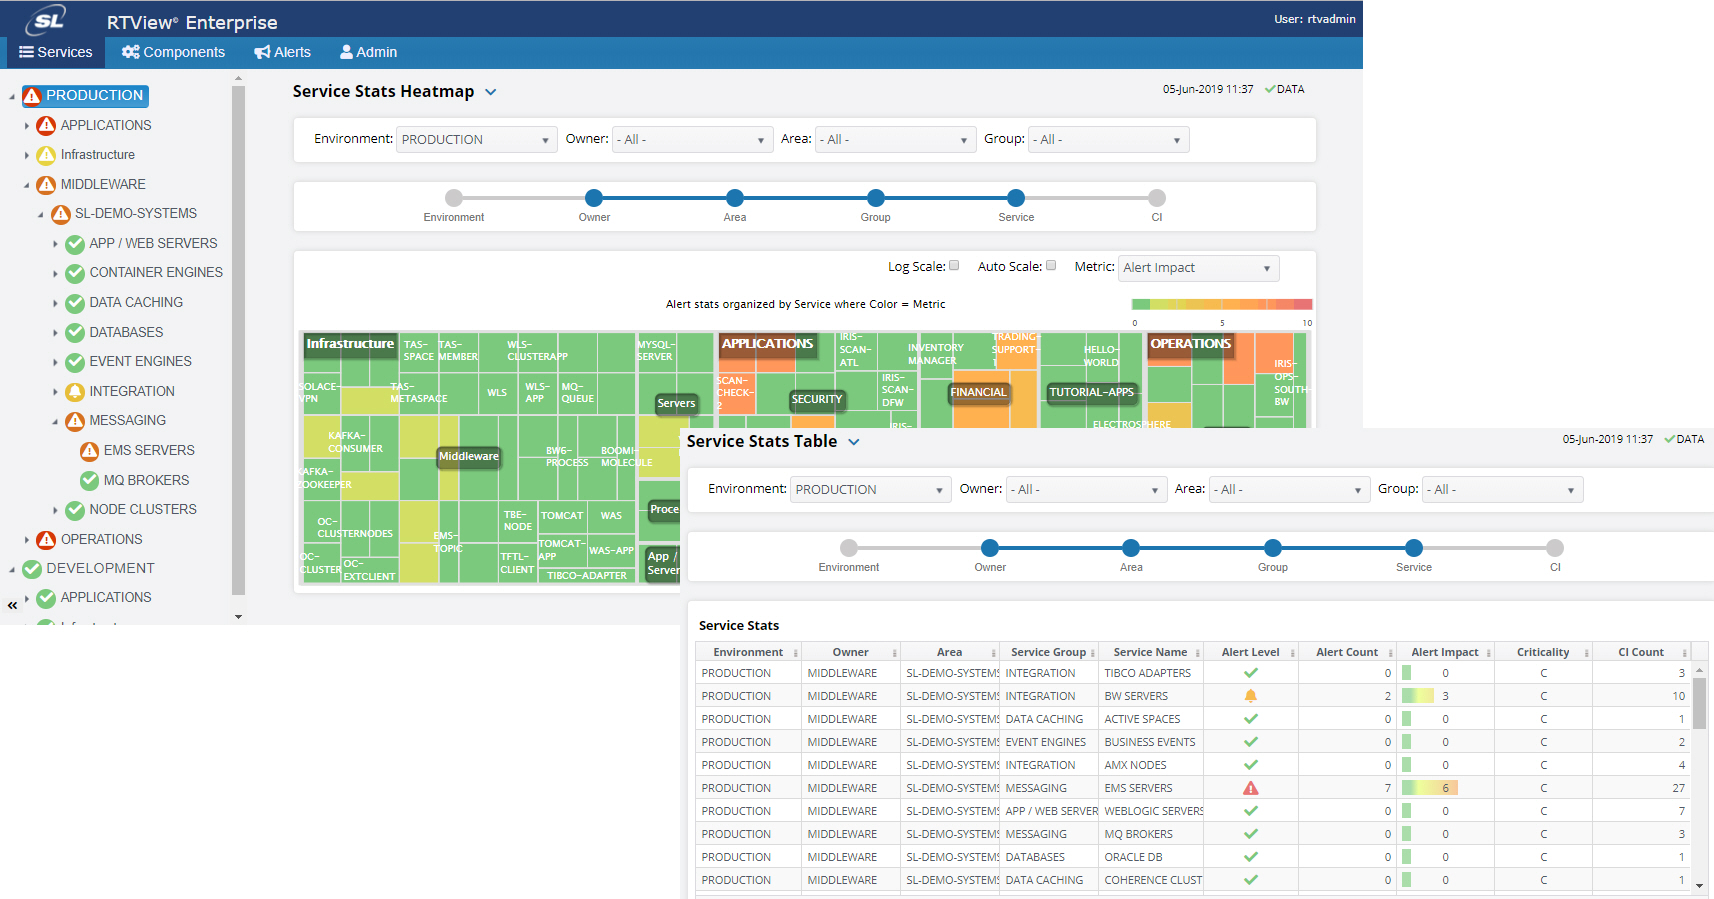
RTView 5.0 now includes an optional HTML5 UI in addition to the classic UI. The new UI displays are built to be highly responsive and present the most meaningful data quickly and accurately. Navigation is improved so getting to important detailed displays is only a click away. The displays are built to support any device including smartphones and tablets.
Alert Detail
In addition to current values, the alert detail display now provides metric history for the alerting component. There is now a alert history table as well for each individual alert.
Users can quickly drill down from the alert detail page to the associated component monitoring display. Less clicks are required to get to the root of a problem.
Overview Display
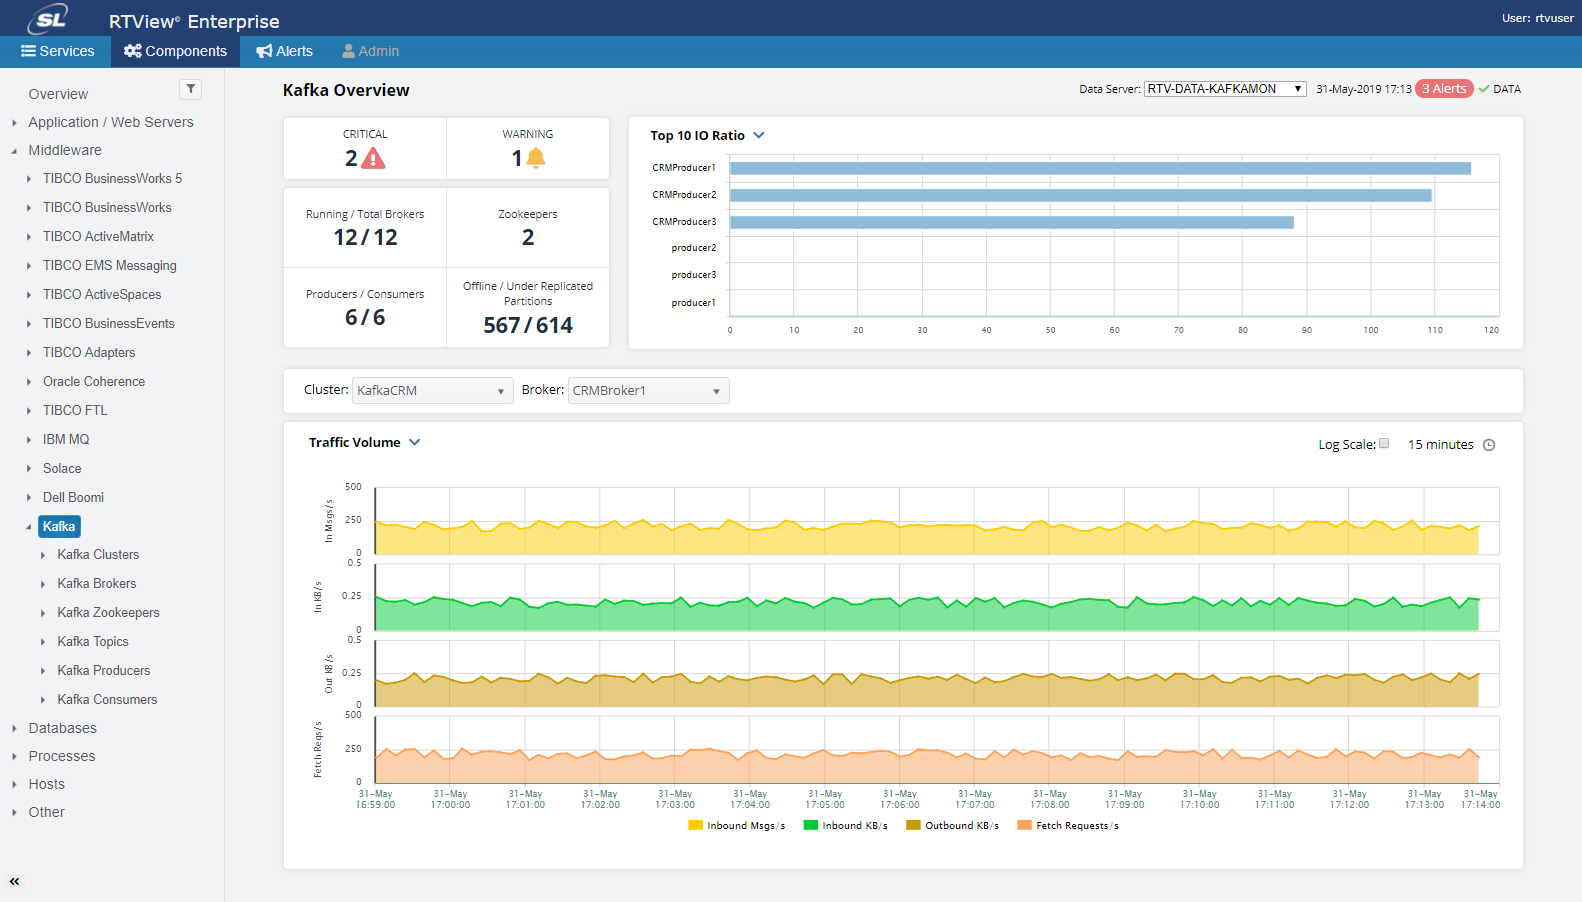
Overview displays provide high level health information with key metric cards, alert indicators, and trend graphs. These displays are built to quickly identify trouble spots and improve navigation to the relevant detail displays. Selectable top 10 bar graph views rank technology components by key metrics to quickly identify outliers.
DataServer Additions
Pre-packaged data servers ease deployment efforts. By pre-configuring RTView DataServers with interfaces for specific technology stacks, new DataServer instances can be spun up quickly with less integration effort.
RTView DataServer’s are used for sending data to RTView Cloud based dashboards, and/or for sending data to on-premise RTView Central Server deployments. In 5.0, DataServers are now able to announce themselves to the RTView Enterprise Central Server.
In the 5.0 release, the RTView DataServer product line has been expanded to a family of 7 variants
- RTView DataServer
- DataServer for Infrastructure
- DataServer for TIBCO
- DataServer for IBM
- DataServer for Oracle
- DataServer for Solace
- DataServer for Kafka
These pre configured DataServers work well with containerized type deployment environments as well as distributed enterprise environments.
Improved support for configuring high availability
High availability configuration has been simplified for all RTView deliverables. HA DataServers can now be set up using the new ‘Config UI’ approach, greatly easing the effort required to set up HA DataServer pairs. This means less time and effort is required to configure RTView HA DataServers.
New deployment architecture allows RTView DataServers to announce themselves at startup. Instead of configuring each new DataServer manually, DataServers can now announce themselves to RTView Central servers. This reduces set up time and effort while eliminating possible configuration errors. This new architecture better supports distributed container-based deployments as you can spin up new DataServers without making changes to your central servers.
Enhancements to Solution Package for Apache Kafka
- Added JVM metrics to Broker, Producer, Consumer caches, displays, alerts, and key metrics
- The following displays have been enhanced:
- All Brokers Table, All Consumers Table, All Producers Table
- Added columns "CPU %" and "Mem Used %"
- All Brokers Heatmap, All Consumers Heatmap, All Producers Heatmap
- Added "CPU %" and "Mem Used %" to mouse over tool tip.
- New alerts:
- KafkaBrokerCpuPercentHigh
- KafkaConsumerCpuPercentHigh
- KafkaProducerCpuPercentHigh
Enhancements to Solution Package for Solace
- Improved drill down behavior of Solace Neighbors topology diagram
- Data queries improved to work with heavily loaded router
- Bind-requests removed from SolClients cache
- Brokers Table no longer empty when collecting data from cloud brokers
- New Solace Event Module
- Three new alerts for Solace monitor for monitoring Syslog Events for the scopes SYSTEM, VPN, and CLIENT have been implemented: SolEventModuleBrokerAlert, SolEventModuleVpnAlert and SolEventModuleClientAlert


