How Real-time Do You Need Your IoT Data Visualization To Be?
OnBlog, IoT Dashboards
SL participated at the recent IoT World Conference in Santa Clara. It was an exciting event for us for two reasons:
We demonstrated our RTView Cloud integration with Software AG Cumulocity IoT platform in the SAG booth. SL provides a custom Cumulocity data visualization solution that enables Cumulocity users to create and deploy custom visual applications from within Cumulocity’s Cockpit or any web browser. It is available as an SL GitHub project.
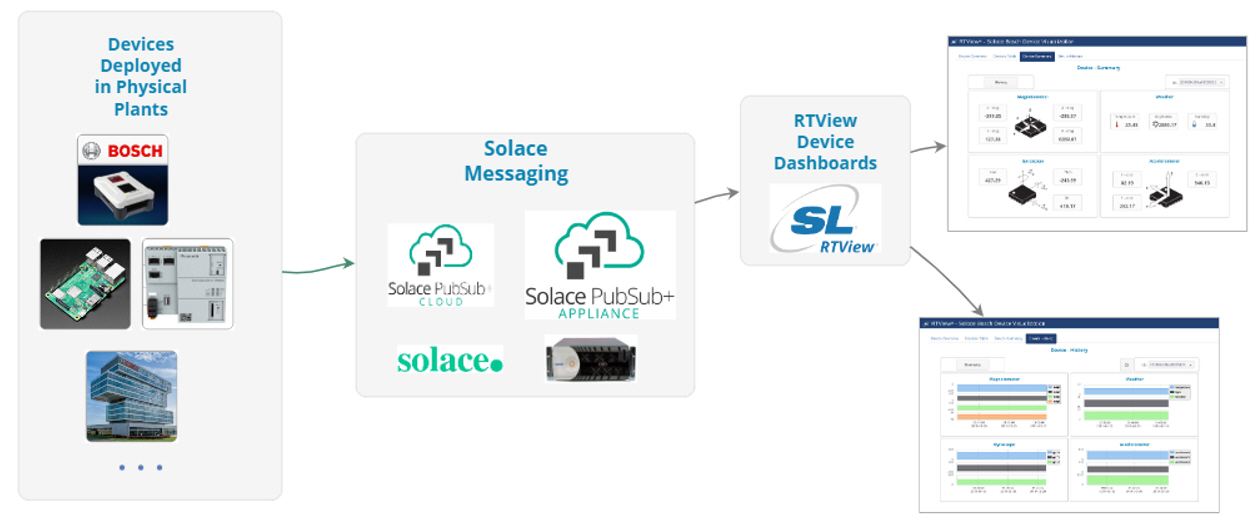
We also co-exhibited in our SL booth with Solace to demonstrate a partner integration for Bosch, Solace, and SL. The demo consisted of Bosch XDK sensors attached to two miniature race cars running around a race track. It was a great illustration of a high-performance IoT infrastructure. Here are some of the details:
-
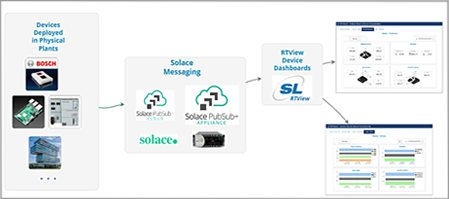 Sensor data is sent via MQTT pub-sub messaging protocol to a Solace Software Broker running in AWS, then to a central Solace Broker on AWS in Germany
- Data is routed back to a browser client running a 3D IoT data visualization built with RTView Cloud for IoT
- IoT data visualization updates are shown in RTView in approximately 300 milliseconds of the events occurring with up to 50 datapoint updates/second
The miniature race car demo was shown concurrently by Solace and Bosch at Bosch Connected World two weeks ago in Berlin and well received there.
This integration got a lot of attention at IoT World and Bosch Connected World because of the high performance of the entire system. Not every IoT use case will require this level of real-time messaging and data visualization performance but many do.
SL’s approach is unique in the IoT space for three reasons:
- We are working with IoT platform vendors and ISVs who want to provide their customers with a custom data visualization option
- RTView Cloud displays and dashboards for real-time data can be customized in almost any way imaginable by users. This can even include the embedding of 3D libraries as a SL GitHub project.
- It provides a data management framework to support scalable visualization.
Coming next: Minding and Addressing the Gap in IoT Infrastructure Monitoring
Categories: Blog
IoT Dashboards